

Number Gooooooooo (drumroll please) - Down?
Number Gooooooooo (drumroll please) - Down?

Since my last post, summer has officially begun and our seasonal Spring cycle has peaked in the U.S., culminating in Summer Solstice revelers who danced into the night in celebration of the longest day of the year. Not really knowing anyone who did the latter anymore, I do wonder about our human seasons and cycles and how they play into what we see transpire in the housing and financial markets. For example, NVDIA reached its intraday All-Time-High (ATH) on June 20th of this year (for now?). Do our natural human rhythms speed up as the days get longer? In times past the extra light would have been used for work, hunting, planting, growing, tending as winter months are more constricted, dark. After particularly hard winters does the hope which springs forth with every new blossom and sign of life become a little manic?
And what happens once that season has come and passed? As cool breezes turn to warm slaps, does reality start to set in as we look back wondering where indeed we got all that energy, and what, Dear God, were we thinking?
As I have been writing and talking on YouTube, tis the season for the housing market, but we are on our way out. For new home builders, prices typically see their largest increase from March to April, while existing home prices tend to rise the most from May to June.
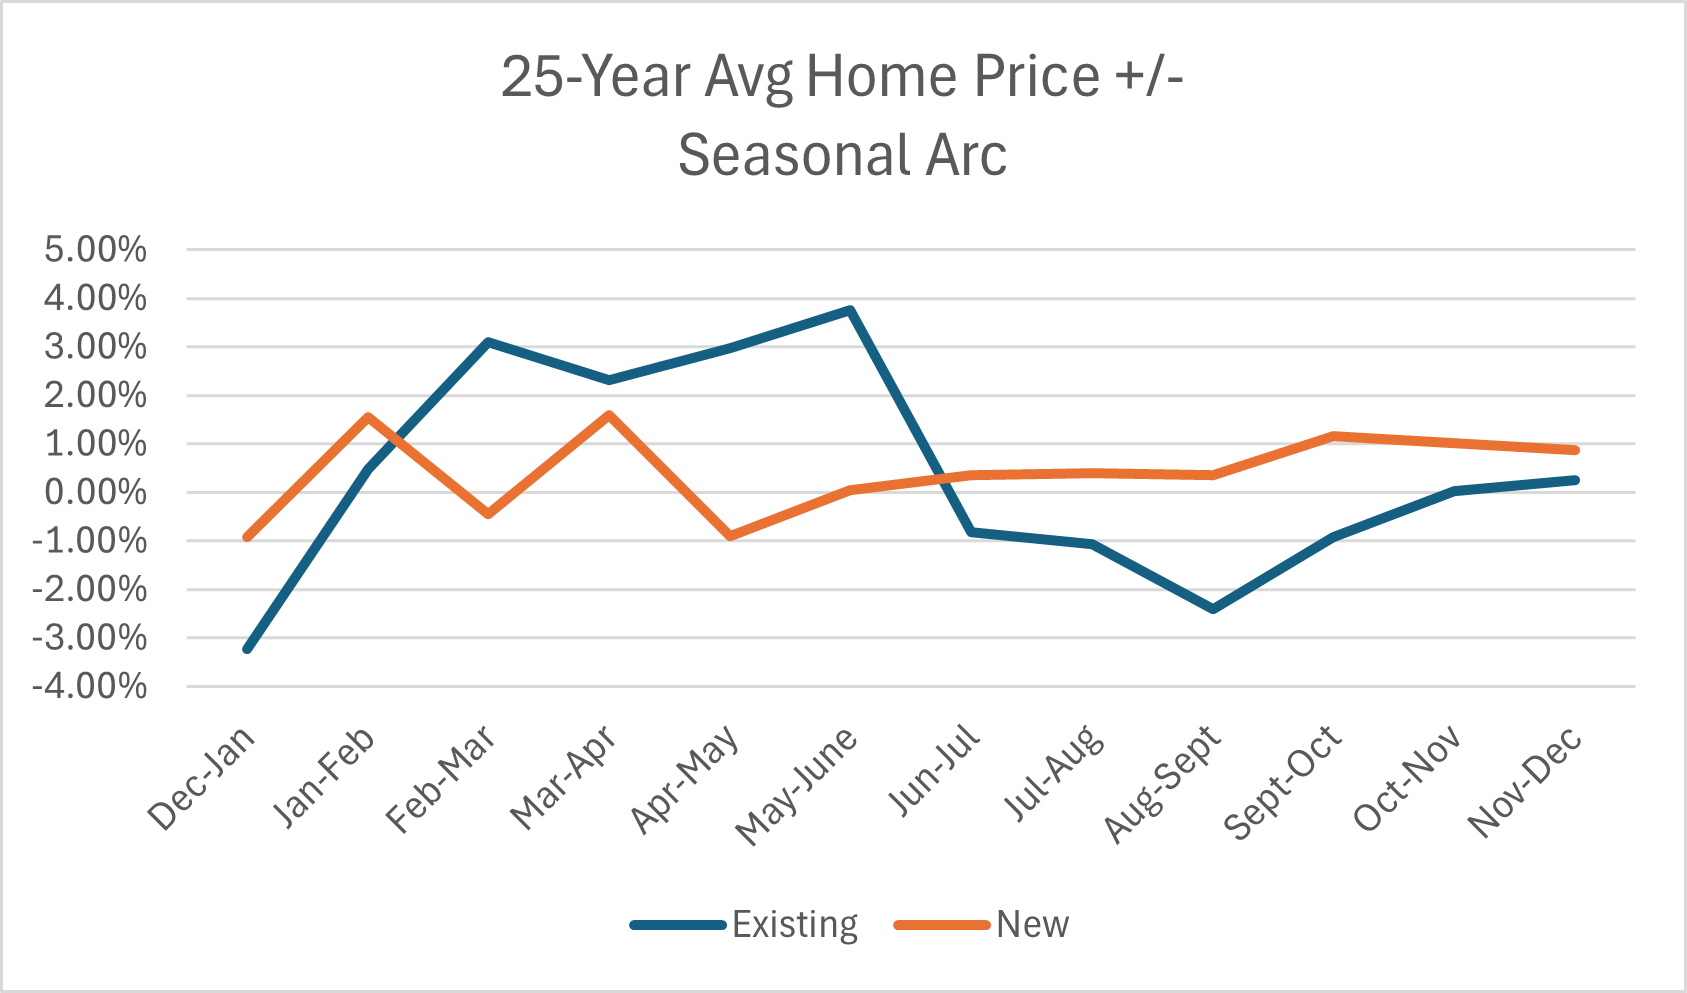
Why the differences? While the existing market is largely driven by forces around school ending and beginning, holidays and travel plans, I believe that the new home market is more driven by the financial and sales cycle, meaning that the national builders tend to raise and lower prices into quarter-ends and beginnings to drive momentum. Needing to align with buyers and sellers and their cycles, the first two quarters of the year are the most important, and the two quarters filled with the largest swings in prices for new homes.
Averages, medians, month-over-month (MOM), year-over-year (YOY), drivers, metrics, data sources, data methodology…..individually no one metric, data point or view would be able to give us even a rudimentary understanding of what is going on in the housing market or the financial markets. Our focus here is on trying to look at these complex systems from various perspectives to give us clues about the path ahead. So, for a moment we will use this arc to frame the results we just received for existing and new home sales.
Although I had warned we would likely pierce the ATH for existing home prices this season it was still shocking to me and embarrassingly took a moment to digest as I misread the WSJ headline. I spent several minutes thinking they were referring to the MOM or YOY increase being the highest in history, but no, they meant the ATH. I had not been out partying or celebrating the Summer Solstice, but I did/do feel exhausted by the mania, fervor and narrative. Even if I can remain sanguine most days about what is ahead, I am not immune to the influence of these forces. I don’t believe any of us are, no matter how contrarian we may be.
Non-seasonally adjusted, existing home sales were down -1% YOY and up 12.20% MOM. As mentioned, we passed the June 2022 high of $413,800K and have set a new record for median home price as reported by NAR: $419,300. The 25-year average for increase in sales from April to May is 9.69% which means we are coming in a little hotter on existing home sales due to what I believe is motivated selling which I will define and discuss below in my detailed, monthly M3 Market Update on sales, prices and inventory in 82 cities. If we are to intimately traverse the arc this year, then buckle up for that ATH to be even higher next month. Based on the 25-year average, we typically see a 3.76% increase in existing home prices from May to June which would bring us to an existing home price of $435,066.
Part of what has been driving these month-over-month sales in my opinion is the NVIDIA/stock market mania and growing 401K balances. I have heard several anecdotes from family and colleagues about every Jo and Jane Shmo asking about the stock market, reminiscent of the famed exchange between a stock market analyst and a shoe-shine boy before the 1929 crash.

Taxi drivers told you what to buy. The shoeshine boy could give you a summary of the day's financial news as he worked with rag and polish. An old beggar who regularly patrolled the street in front of my office now gave me tips and, I suppose, spent the money I and others gave him in the market. My cook had a brokerage account and followed the ticker closely. Her paper profits were quickly blown away in the gale of 1929
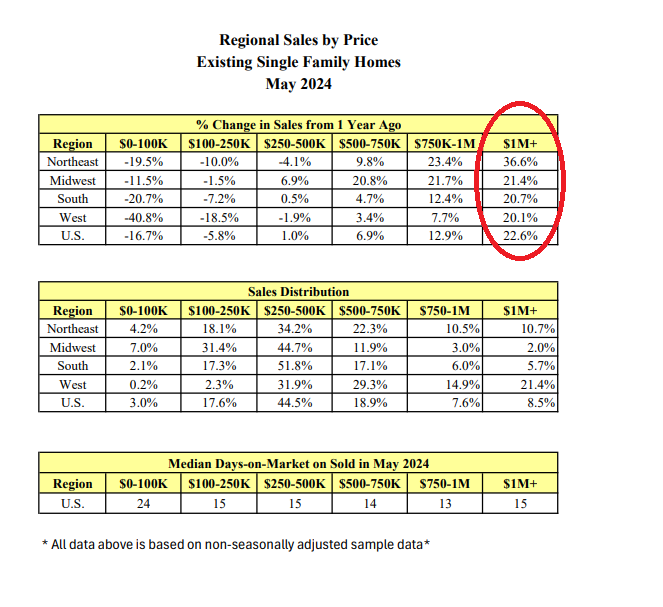
Has NVDA peaked, or are we in for some bumpiness ahead? For clues, I recommend this excellent piece on the state of things in the stock market from a real veteran, John Hussman. Similarly, we may ask ourselves, has the existing home market peaked for the year? If so, we may finally be experiencing a true shift in the dynamics of the housing market. Much ado has been made about sales being lower, but prices have remained stubbornly high. I believe this is because as we are moving through this inflection point the median is giving off false signals. I have shared this schedule before, but it is so critical to understand what is happening….and no, we all can’t suddenly all afford $1M homes.
There are several affordability indexes out there with varying methodologies. Where they seem to diverge due to inflation-adjusting and other mumbo jumbo is whether it is more unaffordable now than in the 80s. As discussed in my last post, the 80s are a bit more complicated than armchair warriors would have you believe. One of the most important things about the 80s from my perspective is that we had women joining the workforce to help with expenses. Before studying macro and realizing this was the story of my Generation, I knew this story because it was the story of my family. My father, a young teacher, had believed he had calculated everything properly to afford our new home in Yazoo City, MS. But as inflation hit my parents found themselves in an impossible situation which led to them both deciding my Mother had to go to work. Neither were prepared for that lifestyle believing my Mom would stay home to care for us and our new home. As the bills and stress piled up so did the fights which would lead to my parents getting divorced and us losing our home to foreclosure.
Was it more unaffordable then? Does it matter? It is unaffordable enough now to wreck families and futures. From Bill McBride and his affordability index which he has been constructing since 1976:

In March 2021, the payment on a $500,000 house, with a 20% down payment and 3.08% 30-year mortgage rates, would be around $1,704 for principal and interest. The monthly payment for the same house, with house prices up 30% over three years and mortgage rates at 6.83% in March 2024, would be $3,389 - an increase of 99%! Almost double.
The household median income in the United States, according to the Census, is $75,019. The Census is a bit delayed, but we know that wages are not rising at the pace needed to catch up with home prices. To afford a $3,389 payment comfortably, you need a household median income of $120,000 and have NO DEBT, plus $100K in the bank. How many people in the U.S. can afford that, especially in our younger cohorts?
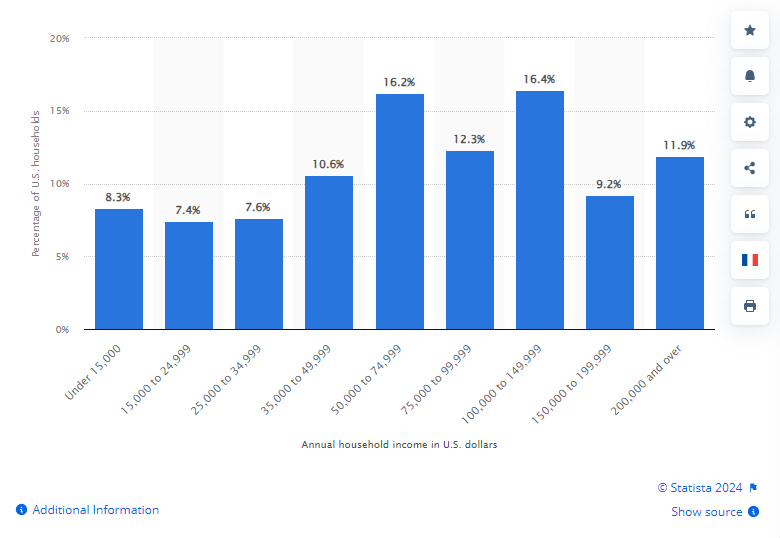
If we look at the chart above on wage distribution it looks like 37.5% of Americans might be able to afford a home. However, remember what I said about the no debt part?

Before you say their parents or grandparents will chip in - according to a LendingTree study, 60% of Americans live paycheck-to-paycheck. Almost 11% of people over 65 live in poverty. Yes, it’s lower than other age groups, but increasing. Whether we like to acknowledge it or not, all Boomers are not rich. In fact, they are the biggest contributor to our increasing homeless population. With the increases in property taxes and insurance this year across the country (not just TX and FL), many Boomers may soon find themselves dangerously close to falling into poverty.
If you own your home, you know that unexpected expenses are a given. Just one air conditioner breaking or roof repair can sink you. Yet, every day I hear from people across the United States who so desperately desire to obtain home ownership, and I want that for them. If you buy now though without the proper reserves and cushions, please remember my tale from above. These things have a way of becoming an albatross that is too heavy to bear, especially when employment has started to look like this:
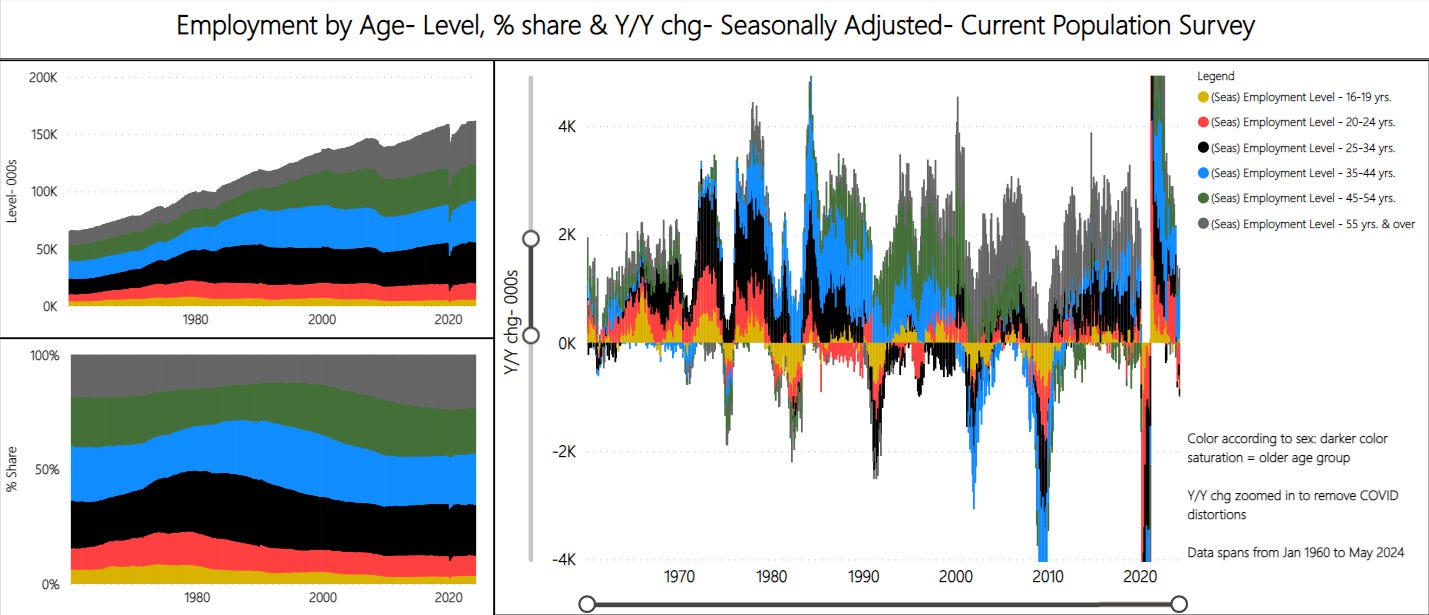
Courtesy of the DataViz GOAT KennyCap_PhD
Will the outsized increases in sales and prices month-over-month for existing home sales persist for June? It seems like a good possibility especially as many contracts were signed in March, April and May. YOY sales being down are a function of what was happening last year. The quick cleanup of the banking crisis meant people went out shopping again after believing recession was imminent coming into the first of the year. In that vein, one thing to note about the new home series versus existing is that new home sales are theoretically captured at contract signing whereas existing home sales are for closed sales and contracts signed 30-60 days ago, so there is a lag.
The other factor to consider will be how the builders responded in June. May was a very different month for them. You may remember all those crazy revisions last month that went back to 2020 from the Census’ Survey of Construction. This indeed is a volatile survey, but it is still an indicator worth watching as the arc illustrated in the chart did not change materially with those adjustments - just the depth of their peaks and valleys.
New Home Sales for May were quite the disappointment on many levels which will be one focus this week. By looking at combined sales we will also see how we are tracking to crisis levels as well as what this may mean for June and the path ahead. Additionally, I will be sharing the very detailed M3 May Market Update which is a deep dive into sales, prices and inventory for my 82 cities as well as by state and Census region (hint: it wasn’t just FL and TX that saw MOM and YOY price declines). I have added some interesting views which include places were sales are down and prices are down YOY and MOM to identify who is not enjoying the season. Another view will show what I’m calling motivated selling - places where sales are up and prices down. For that definition and more, please join me as we dive into the nitty gritty.
Keep reading with a 7-day free trial
Subscribe to M3_Melody Substack to keep reading this post and get 7 days of free access to the full post archives.