


As I drove slowly through Fort Myers Beach on my way to Miami, staring at the turquoise and pink concrete rubble and devastation littered with For-Sale signs, I realized I had not yet even looked at the reduction in Airbnb listings post Hurricane Ian. Having just recently gotten access to the historical data for Airbnb listings for all the cities I track, I had not had a chance to truly digest the information prior to hitting the road with little time between the family trip and move. Fort Myers had definitely seen increases in listings for sale (over 20% since January) and listings for rent (6% since I started tracking in May), but what did this do to the short-term rental market and its investors?
We have all by now (ad nauseum) heard that Florida became one of the top destination spots during COVID as many flocked here to take advantage of the lack of income tax and (for some) the political situation. But even prior to COVID, according to the Census, Florida was a top destination spot post World War II, outpacing the national average for growth.
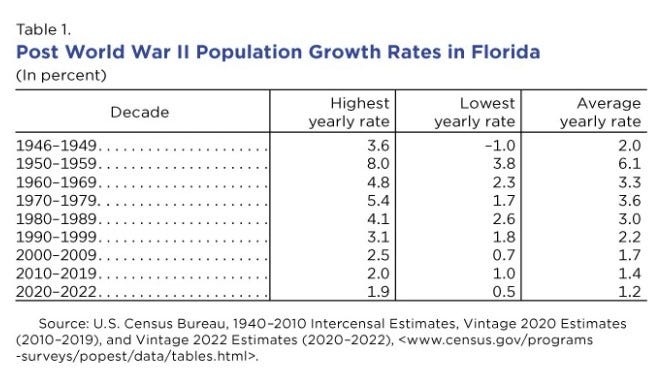
So although there has been much drum-beating about COVID migrants, it seems as if this is fairly status quo for Florida which always outpaces the national average.
I’ve stated previously that what I’ve witnessed across the Sunbelt states in my travels this year reminds me of the Reconstruction bezzle, but as usual Florida takes a special spot in the grift. There are many great books about speculation in Florida, including Bubble in the Sun and The Swamp Peddlers, that illustrate why Florida is always so ripe for fraud, foreclosures and folly. In Bubble in the Sun, Christopher Knowlton argues that the bursting of the great Florida land bubble was in actuality what caused the prolonged economic and social trauma during the Depression and that the land boom, not the stock market was the true catalyst. Eroding economic fundamentals due to the bursting of the bubble pulled down the stock market, highlighting this land bubble as one of the most consequential financial manias in history. And it started in many ways similar to our recent COVID frenzy by people not being able to travel as freely to other continents, but in this case the restriction was due to World-War I. And similar to our Ever Given episode in the Suez Canal which exacerbated our COVID supply issues, there was also a ship full of lumber that got stuck in Miami’s harbor highlighting yet again that nothing is different this time.
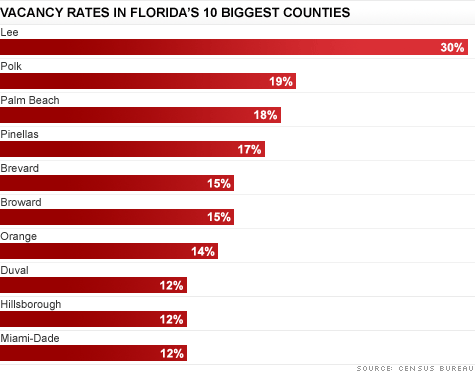
But, let’s rewind in recent history to the GFC. Remember the scene with the stripper from The Big Short? Small investors and speculators took advantage of the situation in hopes of - you guessed it - rental income. You may remember as well from that movie the landlord who took the mortgage out in his dog’s name. As adjustable rate mortgages (ARMs) reset, investors quickly tucked tail and ran away causing the decline in home prices to start just as prime borrowers who were coming under stress due to rising costs and then ultimately the aftershocks of the GFC, needed to access their equity. Thus the contagion from subprime infected your prime borrowers, compounding the issue exponentially and causing price drops of up to 50% in some areas. In 2011, Florida had the highest vacancy rate (20%) for single-family homes due to the devastation from the GFC.
As mentioned here previously, I spent a good deal of 2012 in Florida traveling the state dealing with the default crisis and witnessed first-hand the Government Sponsored Entities (GSEs) “intervention” which sparked the flames for our current situation as they eagerly took over the Real-Estate Owned (REO) portfolios from the servicers to deliver them into the hands of your hungry Wall Street investors. It’s all a bit ironic if you think about it especially as the GSEs tout its affordable home programs. A jaded person could think that they even understand what they are doing - enticing borrowers who simply cannot afford a mortgage into one with programs that require less than 1% down or even no down payment, knowing what the inevitable outcome would be. Do I think this? The time I’ve spent working with government officials from these agencies and the Fed during the last crisis would not lead me to believe they understood this dynamic. But, if they still don’t understand, that is a serious problem.
So cheap homes in sunny Florida became ripe for the picking. Even in 2019 and early 2020 you could find properties here cheaper than in many places which set the stage perfectly for the Airbnb jocks. And beautiful Fort Myers glistened, experiencing some of the largest growth in population for any Florida city with a 11.1% increase between 20 and 22, right in time for Ian. Located in Lee County, one of the hardest hit by the GFC as indicated by the chart above, Fort Myers, in addition to being the spring-training home for the Twins and Red Sox, is renowned for the beauty of its beaches. At its peak in July 2022, with a population of 95,949 people, Fort Myers had 2,841 listed short-term rental properties. Unfortunately, Ian did not concern himself with such tidbits, wrecking Fort Myers Beach in ways reminiscent of the scenes from Tuscaloosa after the tornado, Twister or Day After Tomorrow. As of June 2023, Fort Myers short-term rentals have decreased to 711 listings.

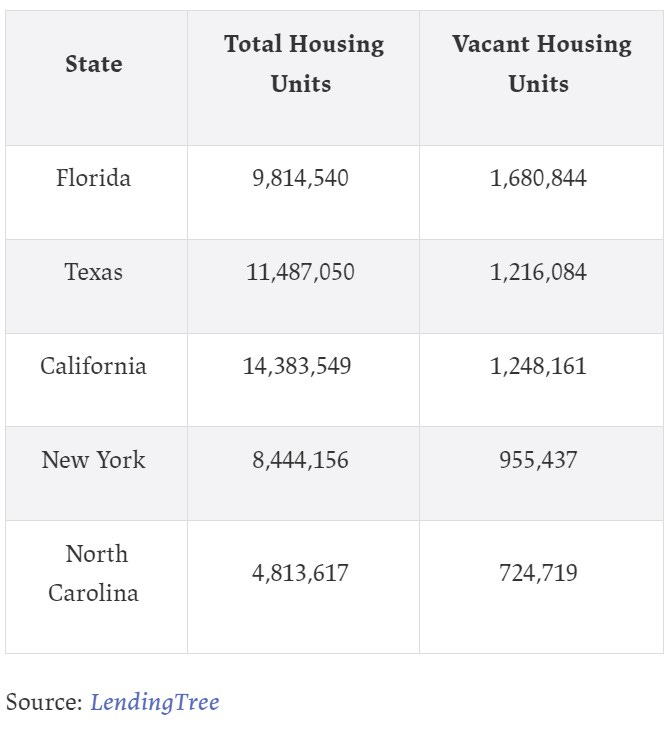
Although the above Twitter post references properties in Massachusetts this is a national phenomenon. I have spoken to several investors, realtors, brokers, etc. who said that many investors bought properties to Airbnb sight unseen based on a delusion-filled descriptions and modeled projections that had no bearing in a post-COVID reality. As I mention in my January HousingWire article there are approximately 14-15M vacant properties in the United States and that was as of the 2020 Census - before our explosion in building. And, Florida takes the top spot according to LendingTree:
Prior to arriving in Fort Myers I toured Punta Gorda and Port Charlotte in Charlotte County which had also been hit by Ian with TrishFLSun. Charlotte County specifically saw an increased demand for housing after the storm as the construction workers and displaced residents needed temporary shelter. Based on conversations with locals and an emergency response team still working in the area, many Fort Myers residents found housing in Charlotte County waiting for insurance checks and repairs to be done. And many are still waiting. Florida is known for insurance disputes and has the highest percentage of litigated claims in the nation. But that did not stop the building bonanza as national and local, private builders piled in and on top of each other. In Charlotte County specifically, the primary focus seemed to be on built-to-rent (BTR) to house the construction workers in tiny, block, duplexes and spec homes, some of which look like prison barracks. The port-o-potties line the streets as they did in so many of the cities I have visited since February. The picture is mixed with some in progress; some completed, but empty; some occupied, but many are half-done, work seemingly abandoned. And of course the multi-family builders couldn’t miss out with rows and rows and rows of new multi-family in progress (I’m working on the video and will hope to post it later this week).
What most don’t understand is that it is the convergence of these different phenomenon that will make this so spectacularly painful:
The post-GFC Wall Street scoop that pulled existing single-family off the market to long-term rental (LTR)
The proliferation of second-home purchases for investment fueled by low rates, easy credit and the fix-and-flip craze
The short-term rental (STR) insanity during COVID where YouTube influencers convinced every Tom and Jane with decent credit they could become a millionaire (see Twitter post above)
The multifamily mania inspired by the increase in rents (now slowing) and hungry investors searching for yield during COVID, which is now coming under serious stress due to the credit crunch
The resulting “artificial” existing inventory shortage which inspired builders large and small to get in on the supposed housing shortage leaving us currently with 7.4 months of new-build supply, with additional supply still in progress (link to Calculated Risk blog embedded with images):

Any idea where we might end the year? I think there is a decent shot we will beat that January 2009 record. Care to wager? The only way we miss is because the official numbers seem to already be missing inventory based on what I see before my eyes while on the road likely due to the private builders who did not list properties on listing sites and made end-runs around certain permit requirements. The Survey of Construction which tracks this activity has perplexed me since coming back from my first trip in February. It simply doesn’t reconcile.
And with the largest amount of multifamily in progress since the 70s, many of which I saw empty during my travels, things are getting hairy with liquidity crunches starting to show in delinquency numbers:

Initially, I believed Texas would be the epicenter for this new crisis, but I think in reality it will be Florida, it is always Florida. Of the 9 cities I currently track in Florida, there is a combined 49.5K short-term rental listings. Based on county research I and others have been doing, there is a lot of deed-flipping and fraud going on as people scramble to cover their losses and grab enough cash to keep going. Since extend and pretend is no longer an option for many due to rising rates and the credit crunch they are doing whatever they can to Stay alive til 25! Comparing the same week in July, in the cities I track, the average daily rate (ADR) decreased by an average of -21.16% from June. That is not a typo.
As I have been tweeting from the road, I have been given several suggestions on places to visit. I will be touring Florida for the forseable future (time yet determined) with a home base in Miami. Stay tuned for updates.
The music is about to stop and there are only a few chairs left before many in our country find themselves Airbnbroke.
Stats for the Week:
Listings for Sale
Listings are up on average 1.64% for the cities that I track week-over-week with some notable movements.
Top Cities with Largest % Increase in Inventory Week-over-Week (7/16-7/23)
Costa Mesa 9.52%
San Ramon 7.83%
Encinitas 7.50%
Oakton, VA 7.06%
San Jose 6.03%
Honorable Mentions: Brattleboro up again at 5.88% and Nashville at #8 at 5.47% (IMO- Nashville is the market to watch)
Top Cities with Largest % Increase in Inventory Compared to 6-week Average
Brattleboro 16.67%
Encinitas 14.45%
San Ramon 9.73%
Carlsbad 8.96%
Oakton 7.42%
Top Cities with Largest % Increase in Inventory from Start (1/1/23)
San Ramon %106.67
Coeur d’Alene 87.82
San Francisco 62.07%
Denver 61.66%
Austin 55.41%
San Jose 46.53% (up from #9)
Portland 46.11% (up from #8)
Carlsbad 42.86% (up from #10)
Galveston 42.05%
Seattle 41.89%
Rent
Top Cities with Highest % Increase of Single-Family Rental Listings (7/16-7/23)
El Cajon 26.35%
San Diego 8.86%
Washington DC 8.13%
Destin 6.90%
Augusta 6.21%
Top Cities with Highest % Increase of Single-Family Rental Listings to Average
Winter Garden 20.87%
Augusta 17.37%
El Cajon 15.53%
Destin 11.86%
Oceanside 11.81%
Top Cities with Highest % Decrease of Single-Family Rental Listings (7/16-7/23)
San Ramon -20.45%
Rosemary Beach -11.11%
Sevierville -5.26%
Bakersfield -2.89%
Dallas -2.85%
Airbnb
Top Cities with Highest % Decrease in Average Rate from June to July for Same Week
Destin -46.67%
Rosemary Beach -44.05%
New York -42.29%
Encinitas -41.97%
Chicago -38.10%
Top Cities with Highest # of Airbnb Listings in June
New York 26,706
Miami 14,630
Las Vegas 13,072
Los Angeles 11,847
Houston 11,776
Austin 11,072
Atlanta 10,907
San Diego 10,115
Orlando 9,335
Nashville 8,105
Top Cities with Highest Average Daily Rate - June
Rosemary Beach $787.02
Newport Beach $708.33
Cape May $559.16
Destin $548.57
Encinitas $517.59
Top Cities with Highest Decrease in Average Daily Rate - May to June
San Ramon -30.95%
Victor WV -15.81%
Destin -12.51%
Ventura -7.01%
Rosemary Beach -6.49%
Palm Springs -5.27%
Knoxville -5.22%
Chicago -3.50%
Nashville -2.96%
Sedona -2.87%
Commercial Real Estate (CRE)
Big news last week was Cerberus missing its loan payment on a portfolio of Marriott hotels. Cerberus and I go way back as they were the ones who bought GMAC ResCap (my former company) at the peak of the last cycle. As I said on Twitter, I doubt seriously this will be their only starring role this cycle.
One of the reasons Cerberus cited for the default was the rising cost of insurance. Yes, siree. That is going to send a lot of folks right over the top - and not just homeowners:

Local malls seem to be the special for the week, but pretty soon everything, including sacred industrial, will be on the menu in my opinion.
Going to keep this incredible podcast with Jack Farley, John Toohig and Randy Woodward in this section until they do the next one - it’s just that good.

Per John, the only commercial real estate trading at the moment is for Trash and Trophies and despite MSM narratives trouble is on the horizon. Miss this at your own risk.
Reference articles:
Local Malls, Stuck in ‘Death Spiral,’ Plunge in Value - WSJ
Troubles for Wall Street office tower worsen as foreclosure looms (nypost.com)
Understanding the challenges in the U.S. commercial property market
Commercial Property Investors Huge Office Bet is Unraveling In London, New York and Paris
Commercial Real Estate Reset is Causing Distress from Sand Francisco to Hong Kong
CRE’s Strains are contained: But in a recession the dam won’t hold. (contained you say?)
Big commercial real estate downturn could sink 300+ banks: Report | American Banker
Westfield Gives Up Downtown San Francisco Mall (sfstandard.com)
Goldman Sachs CEO Solomon warns of commercial real estate write-downs (cnbc.com)
Hotel Owners Start to Write Off San Francisco as Business Nosedives - WSJ
Sunbelt Construction Boom Threatens Top Apartment-Building Owners - WSJ
US banks prepare for losses in rush for commercial property exit | Financial Times (ft.com)
Interest-Only Loans Helped Commercial Property Boom. Now They’re Coming Due. - WSJ
Coming Soon: YouTube, Charlotte County video and Twitter Summary. Summer hours and craziness continue as do travels.
Reference
Airbnb
Cities on Inside Airbnb have been recently updated. Will capture those as soon as possible, so keeping the Inside Airbnb data here. Hope to do some comparisons soon.
MARCH
Inside Airbnb has published its data for March and in many cities there were increases month-over-month for listings after significant decreases the previous month. A good example is Austin which went from 18,337 listings in January to 13,808 listings in February and now up to 14,368 listings. Based on my travels I would say that a good chunk of people still think it’s 2021, especially the fix and flippers who may have been constrained by labor or supply chain issues and are coming late to the party. It will be very interesting to watch this trend for sentiment changes post the mid-March banking crisis and now subsequent credit crunch.
Some stats:
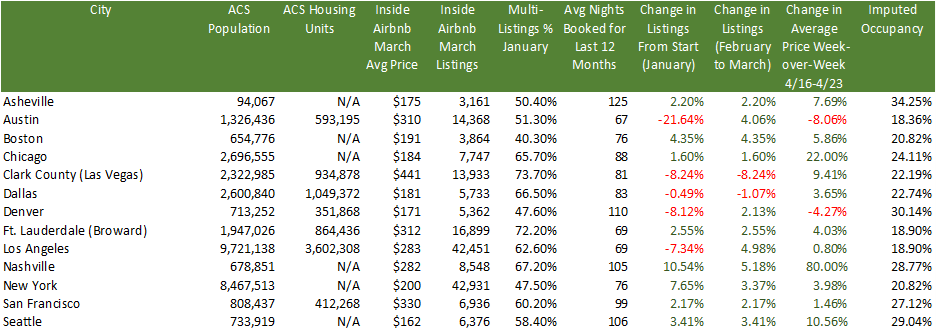
A really interesting stat above is the % of multi-listings per city. This metric represents the % of owners that list multiple properties, not just one. So, in other words, this will give you a flavor to how many investors operate in that market. The average for the cities above for multi-listings is 58.74%. So, despite what Airbnb said on that doozy of an earnings call when no one asked them about their miss in listings projections, their typical client is not someone who is trying to make just a little bit of extra cash. These are investors with multiple properties who are looking for passive income and likely bought these properties with DSCR loans or cash from loans on equity and crypto assets. And, with so many listings the imputed occupancy in these cities is very low and is likely no longer covering debt service cost.
For those who have listened to my Twitter Spaces (check out this one on Airbnb if you haven’t), you know my biggest issue with Airbnb is that besides excursions and nebulous technology improvements, adding listings is Airbnb’s only strategy for growth. I’m pretty sure there is a limit to how many hotel rooms and Airbnb listings we need in each city.
Rents
Rents are cooling from their meteoric rise and this week we see some interesting shifts:
Top Cities with Highest % Decrease in Rent (May to June)
Fort Myers -16.03%
Miami -14.84%
Carlsbad -13.45%
Oceanside -13.45%
Costa Mesa -10.73%
Top Cities with Highest % of Average Rent Price Decreases (April-May)
Destin -7.01%
Rosemary Beach -6.28%
Orlando -4.66%
Winter Garden -4.66%
Costa Mesa/Los Angeles/Ventura County -4.05%
Top Cities with Highest % Increase in Vacancy (April-May)
West Palm Beach 1.00%
Cleveland .60%
San Jose .60%
Knoxville .50%
Tampa .40%
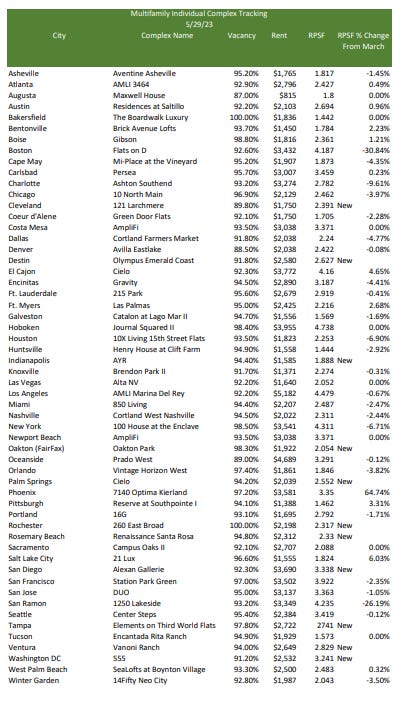
Top Cities with Highest % Decrease in Rent Per Square Foot (RPSF) for Specific New Multifamily Complexes (March-April)
Encinitas -3.57%
Ft. Myers -3.56%
Asheville -3.20%
Tampa -1.76%
Boise -1.09%
Melody, FYI, here are some comments from a builder I know of in gulf coast of FL that is actively building homes right now, on why he thinks prices are staying elevated. This guy has been in real estate 50 yrs, and building and investing for 40+ years. He also correctly and vociferously went on record in 2005 calling the peak and 2008 bust back then.
-thinks prices are only down 3% from peak right now
-35-40% of buyers in Florida pay cash
-Florida is the number one state in the nation for wealth migration (taxes, retirees, politics, etc...)
-Many of the buyers are migrating from more expensive states and have lots of equity from home sales
-people want new and he builds new - no competition from existing sales b/c homeowners won't sell if have <4% fixed rates
-tons of REO's hitting the MLS in 2008 are what really caused the prices to crater - when REO's and short sales dominate the MLS listings - this builder doesn't think this happens this time b/c existing homeowners PITI is less than what rent would be, huge equity positions for buyers who have even only been in house 2-3 yrs, FL is judicial foreclosure state meaning would take years for properties to go back to banks and hit MLS even if there was a rash of foreclosures - he says no danger of glut of homes showing up next 12 mos
Condominiums in Florida turned 60 this year. The first condominium act was passed in 1963. There are 45,000+ units in Pinellas County (Clearwater, St. Pete) alone that are older than 30 years with more than 80 units. salt water and air have been attacking all these beachfront condos for 30, 40, 50 plus years, and many don't keep reserves. Due to the entirely forseeable Champlain Towers disaster, the legislature has mandated inspections of condos older than as little as 25 years. I have seen analysis that statewide condo owner will spend $150-$300 billion on repairs. many will terminate and be repurposed as apartments, imploded and built on, or just so they will be tenants in common because they can't afford to be condos. Fun times coming/here!