Baseline
Housing data is published at the same time of the month each month, so during the quiet weeks I try and dive into some aspects of the data that I’ve yet to explore in this cycle. The weirdest thing about this go-round is that I’m looking at all the same things I did when in a Corporate Financial Planning & Analysis role, but I’m doing it for myself and you instead of corporate overlords, against a macro backdrop, with a little client perspective peppered throughout my analysis.
The mortgage market (that we know about) which underpins the housing market is just so very complicated due to the hyperfinancialization that fuels it. Many of you have rightly said so when I use more acronyms than you would hear on a visit to your local army base. Today, I’m going to provide some baseline data as I’m getting some serious October 2006 vibes from a delinquency perspective. You may remember that in October 2006 I went to a party celebrating the mortgage market where balloons fell from the ceiling and revelers toured a life-sized Lego house just to spend the next several years trying to save our company from bankruptcy.
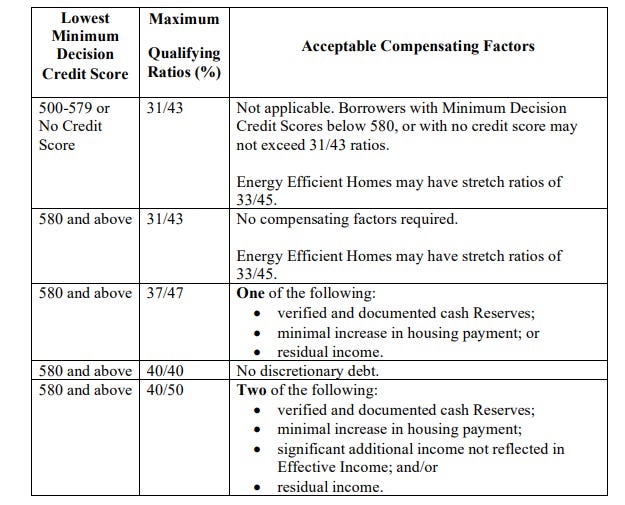
The mortgage market has not been celebrating for almost three years now, but I would argue that due to the GFC-style-with-a-steroid-shot intervention we had with forbearance, payment deferrals, partial claims and 40-year modifications the mortgage industry basically had their cycle party in October of 2021 as a bunch of middle-aged mortgage bankers danced to Pitbull on an aircraft carrier in San Diego (yes, that happened - I was there). While everyone was doing their credit quality gospel singing, the truth was that the workouts bought a serious amount of time...time which some used to continue and even increase risky lending through the Federal Housing Authority (FHA) programs for borrowers with credit scores as low as 580 (and even as low as 500 if you have a large downpayment) and a “backend” debt-to-income (DTI) as high as 57% with compensating factors.
Definitions:
Frontend DTI ratio: represents the percentage of your monthly gross income that goes to paying your total monthly housing expenses (FHA max before compensating factors for a credit score above 580 is 40)
Backend DTI ratio: a percentage that indicates the portion of a person's monthly income that goes toward paying all of their debts, including housing costs (FHA max before compensating factors for a credit score above 580 is 50)
FHA Approval Ratio Requirements:
From Bankrate and other students of credit, the “traditional rule of thumb is that no more than 28 percent of your monthly gross income or 25 percent of your net income should go to your mortgage payment.” Apparently, the engineers of our government programs know better, or they don’t care as the machine is just so important to propping up our gilded economy. Although usually well-intentioned these types of programs fail spectacularly. Take the moment in The Big Short when the broker says, “these people just want homes.” What most don’t realize is the pain and hardship which inevitably befalls these folks when that rise in wages doesn’t come, or that job loss occurs. Their purchasing power is destroyed for years or maybe forever, and the mental anguish is great as I witnessed while managing default during the GFC.
On top of the massive government intervention in the mortgage market, let’s also throw in the bank rescues in 2023 which assured everyone it was all going to be ok and stuck that pacifier right back in the mouth of the financial markets.
The New York Fed recently released its Q3 2024 Household Debt and Credit Report, and we should all be a little nervous for what’s brewing under the surface.
Look at all that orange! Rightly, many are focused on the “seemingly” low delinquency in mortgage. I say “seemingly” because the aggregate numbers, the industry providers, the market mechanisms and the FRED charts mask the true health. Each gives you a limited perspective, but none give you the entire picture which I talk in detail about here. Only GFC survivors or a handful of industry experts could sniff out the trouble to come as the mechanics are just so confusing.
Let’s start with current delinquency as depicted by the NY Fed:
90-day mortgage delinquencies are ticking up slightly, but most don’t understand why these have stayed so low over the past several years which has quite a bit to do with the GNMA buyout and loan modification programs. GNMA stands for Government National Mortgage Association, a government corporation that guarantees mortgage-backed securities.
The majority of Ginnie Mae securities are backed by single-family mortgages originated through the Federal Housing Administration (FHA), U.S. Department of Veterans Affairs (VA), U.S. Department of Agriculture's Rural Development (RD), and Public and Indian Housing (PIH) insurance programs.
Using Black Knight data, as of September 2024, GNMA currently comprises 22.29% of outstanding mortgages compared to 12.88% in September 2004.
The private market which most believe took down the mortgage industry (not so) comprises 3.17% of outstanding mortgages as of September 2024 compared to 13.53% of mortgages in September 2004.
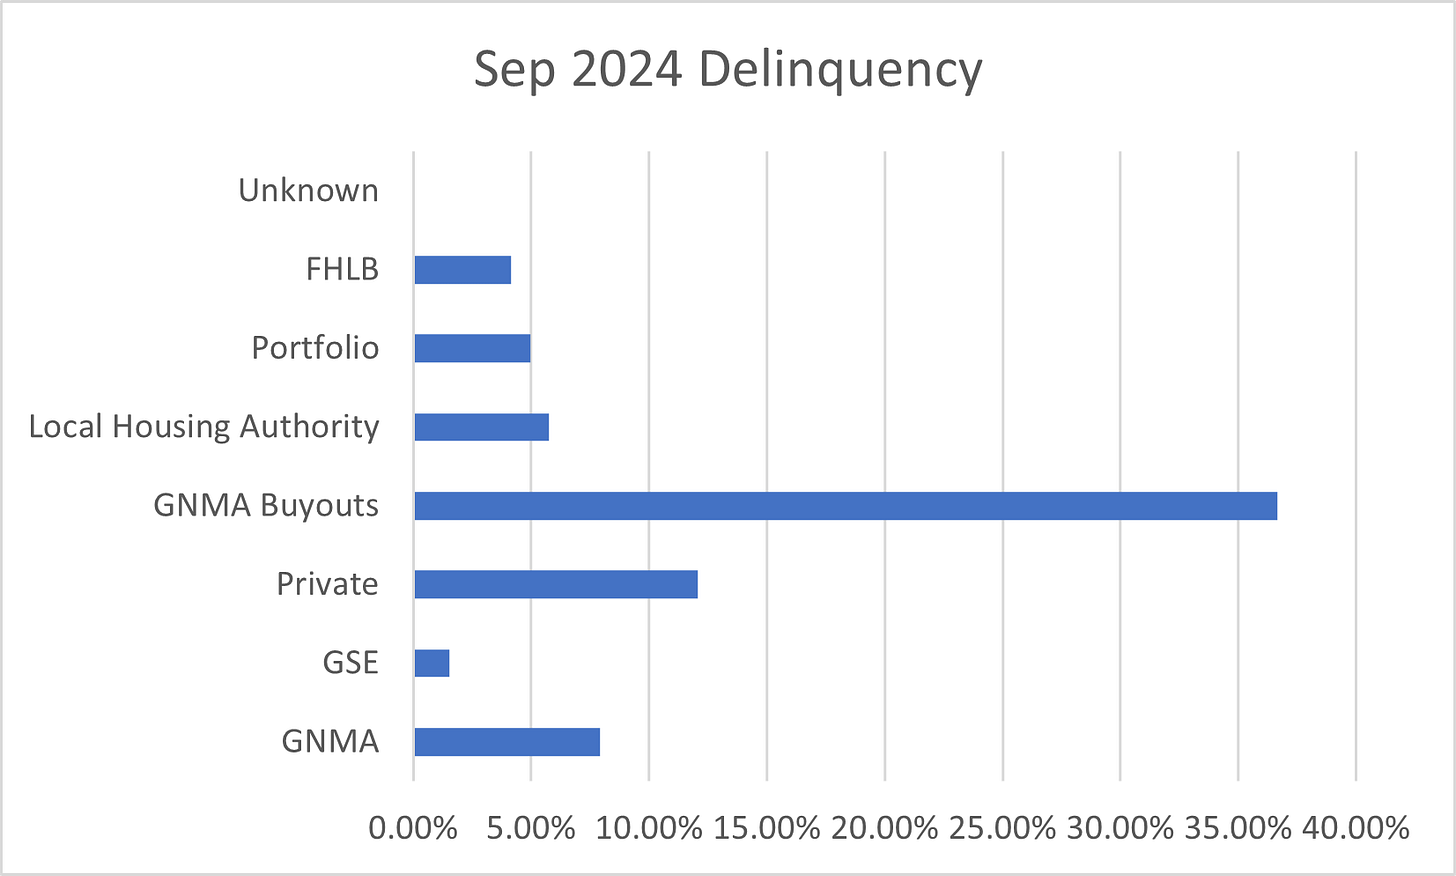
Black Knight, which only has about a third of mortgages and is skewed toward performing loans, shows GNMA delinquency at 7.92%. Here’s a delinquency snapshot for the groups above as of September 2024:
Using Black Knight data, FHA, which is roughly 63.29% of outstanding GNMA loans, is 11.11% delinquent as of September 2024 while VA, which makes up 32.03%, is 4.77% delinquent. Total delinquency for all mortgages in September according to Black Knight was 3.91%.
Are you yawning yet? It’s about to get interesting. Those GNMA buyouts which have been increasing significantly are showing something more disturbing than what the NY Fed can glean from the Experian credit data. What the Hades is a GNMA buyout you may be asking yourself? Good question.
As mentioned above, this post will focus on establishing a baseline for what’s to come, as well as give you a foundation to understand the current market weakness. The wobbliness is apparent in metrics not reported in mainstream media, such as servicing advances and GNMA buyouts. This is hard data that paints an ugly picture that almost no one can see as the Government Sponsored Enterprise (GSE) data as well as the securitization market mechanisms hide the brewing turmoil. Additionally in today’s post, I will provide the city-level analysis for September sales, inventory, delinquency and prices, and my forecast for October existing home sales which will be released next week.
Without further ado….


