

At least once a week if not once a day, a follower or someone who has been open and supportive of my work to date finds a piece of data that stops them in their tracks and routes them right back to me with a challenge. Because I have been living and breathing and contemplating these themes for almost three years, the arguments from my January piece seem so self-evident to me that I often forget how atypical it would be for anyone to look at the housing market the way that I do. But then I stop in my tracks and wonder why we have never looked at it this way. A question for another day….
What would vacation rentals have to do with single-family housing, really, and why should anyone in mortgage care about how many multi-family units there are in a city? If someone wants to buy a house, they want to buy a house, right? Old ideas about who rents, who vacations and who buys obfuscate our view of the current reality and the ways in which since roughly around 2012 our housing market began to transform from a baby casino to the Venetian Macau.

Entre macroeconomics, government intervention and the bezzle. For anyone that thinks we put 2008 behind us - well - I think most are starting to wake up to the idea that no matter how much hand-wringing and credit-quality gospel singing we have been subjected to, no lessons were learned and absolutely nothing changed…..it just shape shifted into the shadows or materialized in a seemingly harmless form in front of our very eyes. As I stood in Austin at a megasite a few short months ago it was the above-mentioned indoctrination that kept me fixed to my spot for several minutes, incapable of seeing what I was seeing just as many could not see the emperor had no clothes.
Dodd-Frank in the end just created more paperwork and more jobs for auditors and lawyers, many of whom do little more than check-the-box. And as I truthfully reflect over the COVID housing boom, I see very clearly that no matter how many hoops someone has to jump through to get a mortgage, where there is a will there is a way - mind you though, not for your average Joe/Joan, but for the motivated investor. And, through the PPP and EIDL programs, student loan forbearance, mortgage forbearance, eviction moratoriums, the way was paved with cheap dollars and the grift got exponentially juiced. The article from The Atlantic linked above was written in 2019 before the unprecedented fiscal and monetary stimulus hit our bank accounts and the bank accounts of hedge funds and the superprime. According to an AP analysis, “fraudsters potentially stole more than $280 billion in COVID-19 relief funding; another $123 billion was wasted or misspent...the loss represents 10% of the $4.2 trillion" disbursed. For context (since billions seems like thousands these days), the $400 billion that was stolen or misspent happens to be almost the exact amount of the proposed student loan forgiveness program. Until these reports on the PPP program started to hit my radar, I myself did not realize that most of us were working for the government during COVID. Don’t believe me? Look up your company on this cool site. So, before retreating to our debate corners, I think it is important to understand that our reality is very different from how it is being framed in order to hide the bezzle that shoddily holds up our current economy.
My obsession with the word bezzle since reading the Michael Pettis piece, likely much to everyone’s chagrin, has to do with the below quote and what it implies:

J K Galbraith, The Great Crash, 1929
Undiscovered embezzlement is underpinning the current perception of our wealth. When thinking of psychic wealth, think about how that home equity made you feel when you started looking at it in 2021 and 2022. Soon though, in the case of housing, increased property taxes and insurance will challenge that perception of wealth so much so that their feelings of injustice will start to remove the scales from their eyes which have been preventing them from seeing the naked emperor and the grift which boxed them in this corner. As the credit card bills pile up and food and services inflation stays too sticky for comfort, the sacred cow of credit quality will start its trek down the mountain….car bill 31 days late this month, mortgage under 30 days, pay mid-month for a few months, mortgage 31 days late in six months.
And as the struggle gets too real and folks feel too hopeless, the pitchforks will be pulled from the back corners of the barn just in time for 2024. And, who will they be chasing? They will be chasing the likes of Invitation Homes and Progress, owned by Pretium, who scooped up properties since 2012, limiting inventory available for sale and driving up home prices through all-cash bidding wars.
Armed with technological and financial advantages, Progress and other large single-family rental firms are more sophisticated than traditional landlords at scooping up homes, filling them with renters and maximizing profits. In their pursuit of higher returns, the largest firms aggressively increase the cost of housing through rent hikes and fees, while skimping on maintenance and passing many traditional landlord responsibilities on to the tenants themselves
Here is a current picture of institutional single-family home ownership in Atlanta, earmarked for rental:

And how do the renters and customers of these companies feel about their landlords?
Over and over, Progress’ tenants described being trapped between two bad choices: Pay outrageous fees they believed were charged in error, or refuse and risk their financial credit when the company’s software locks them out of their account and triggers an eviction filing.
Dealing with these companies who embody the greedy and unforgiving landlord archetype is described as a dystopian nightmare, but for the shareholders, this scheme has been hugely profitable. Many, many have profited from this trend. So much so that multitudes co-opted builders to build more, more, more single-family to rent, causing many to say that the American dream is now for rent. How much Built-to-Rent (BTR) is out there? It is so difficult to say, but I know when I was on the road there would be massive subdivisions being built solely for rental. One of my pals in the builder community recently coined the term Built-to-Ruin as investors failed to see the writing on the wall as other players jumped all-in on the grift creating over-supply, sometimes in the middle of nowhere. A recent study by John Burns Research showed that “institutional investors bought 90% fewer homes in the first two months of 2023 compared to a year ago.” And, Invitation Homes and American Homes 4 Rent have become net sellers of these rental properties. Pretium is still swinging big with a recent $1.5B purchase, but I fear they are just the Cerberus of the GFC days (who by the way plays in this space as well), buying at the top and will soon regret it.
So, if the institutional are becoming net sellers of their existing and new-build properties as they buckle under increased funding costs due to higher-for-longer, cooling rents, property and insurance costs, competition from new and sparkly multifamily which is slowly but persistently being delivered, the selling will increase creating pressure at the margin where price is set.
The next time someone says there is no housing inventory, ask them how they are defining inventory. Is it simply housing stock? Is it existing single-family homes listed for sale only (many, many are only looking at this), excluding the new-builds? What about BTR and short-term rental (STR) stock - does that impact how they view inventory? Take for instance Austin which has 14,368 short-term Airbnb rentals and current active inventory for sale of 5,270 properties on Realtor.com, 7,793 active listings for rent and over 13K multifamily permits have been filed this year so far. If you state these facts to someone they will likely ask you what the heck BTR and STR have to do with active inventory. Well, at the start of the year, Austin had over 18K listings for STR and 3,514 properties listed for sale. Coincidence? Now that I’m tracking single-family rentals in addition to multifamily, we will be able to see whether the trajectory of STR to long-term rental (LTR) to listings for sale is occurring and where.
The banking crisis is not over and American Banker recently argued that 300 banks could be in trouble due to CRE lending, inclusive of multifamily. Although many focus on employment and labor turning over, the real story in my opinion is staring us right in the face and is already here.

*Charts copied from a fantastic QI Danielle DiMartino Booth Substack
The homes being built and listed out there are too expensive for the average American household who would need to make north of $100K to afford a $400K home. So, as Bloomberg recently asked, where are the missing affordable homes? They are lost in the bezzle at the moment. But do not believe for a second we don’t have the housing stock out there to meet our current demographic and economic reality, albeit mismatched in many areas. And, I find it incredibly disingenuous for the dancing bears to ignore these realities which we will discuss and track here each week.
Our American story is filled with booms and busts and get-rich-quick schemes. Built-to-Rent and short-term rental are just the latest manifestations of that odyssey. My goal here is that none of you find yourselves contemplating ruin as a result of being unaware of these facts and the impacts they may have in your backyard.
This week’s updates:
Listings for Sale
Listings are up on average 1.44% for the cities that I track and in 50 of the 63 cities - the most since I started tracking in January. This is not just seasonal inventory based on the other metrics I track. But, stay tuned and see for yourself.
Top Cities with Largest % Increase in Inventory Week-over-Week (6/4-6/11)
Rochester 7.04% (2nd week at #1)
Salt Lake City 5.46% (#5 last week)
Rosemary Beach 4.35%
Bozeman 4.18%
Bakersfield 3.82%
Top Cities with Largest % Increase in Inventory from Start (1/1/23)
San Ramon 81.67%
San Francisco 79.01%
Coeur d’Alene 77.72%
Denver 56.95%
Austin 49.97%
San Jose 44.86%
Boston 43.02%
Galveston, TX 40.15%
Seattle 37.41%
Portland 37.24%
Rent
As we are in the middle of the month, rents remain pretty stagnant during this time of the month. Instead, this week, I will show the change in long-term rental (LTR) listings week-over-week. I have a lot of theories about what is going on here, but I want to spend more time with the data before making big claims.
Top Cities with Highest % Increase of Single-Family Rental Listings (6/4-6/11)
Cape May 50.00%
Sedona 24.07%
San Ramon 21.05%
Augusta 19.81%
Bozeman 19.62%
Top Cities with Highest % Decrease of Single-Family Rental Listings (6/4-6/11)
Johnson City -7.50%
Sevierville -6.67%
Costa Mesa -4.40%
Asheville -4.20%
Oceanside -4.17%
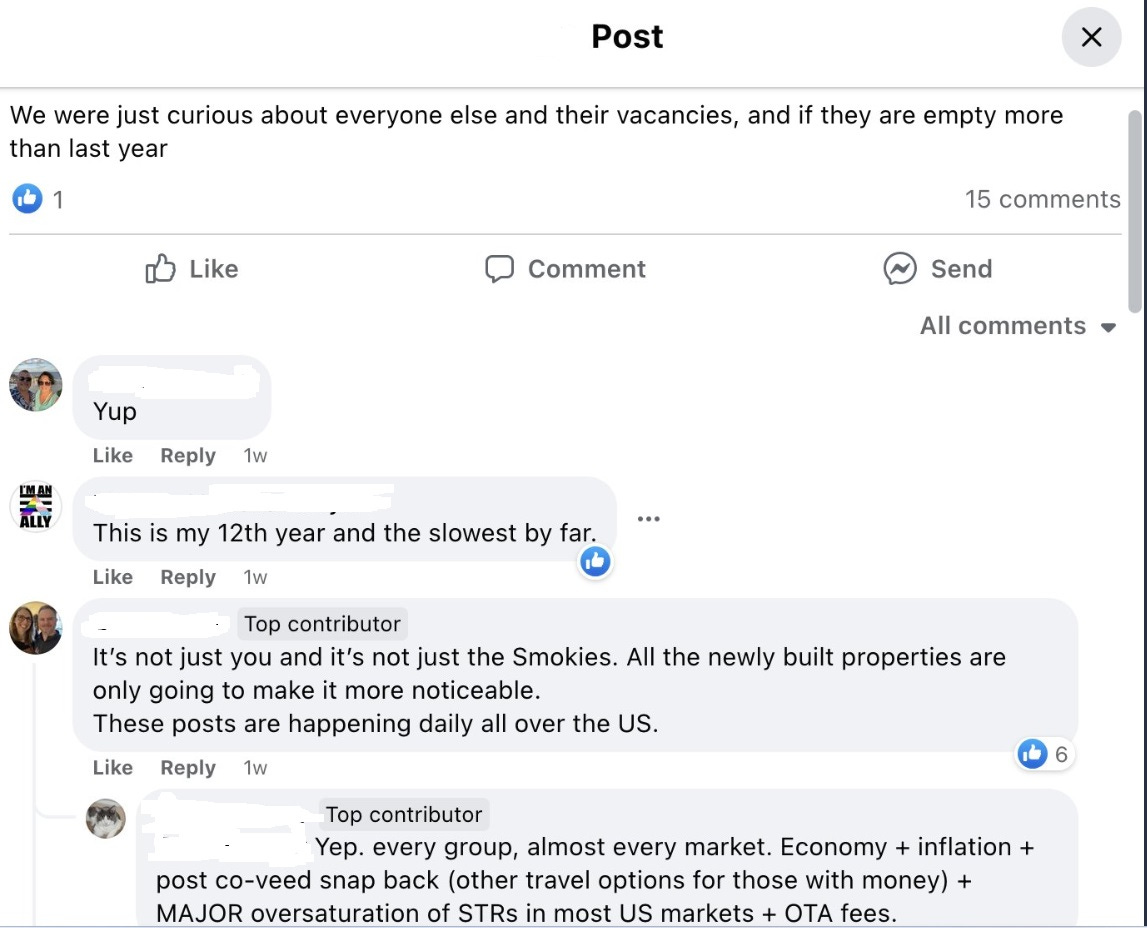
Airbnb
More and more message boards are lamenting the lack of bookings thus far for the summer. I firmly believe it’s critical to watch this space closely over the next several months, so comparisons will primarily be to averages on a go-forward basis.
Top Cities with Airbnb Average Price DECREASES Week-over-Week Compared to 4-week Average:
Tucson -66.07%
Indianapolis -34.50%
Miami -33.35%
Orlando -30.48%
Salt Lake City -29.96%
Top Cities with Airbnb Average Price INCREASES Week-over-Week Compared to 4-Week Average
Oceanside 67.35%
Rosemary Beach 62.90%
Hoboken 57.38%
Carlsbad 54.76%
Austin 38.45%
Commercial Real Estate (CRE)
Surrendered keys and special servicing are the name of the current CRE game. And, by all accounts it is going to get much worse.
This week’s feature is an incredible podcast with Jack Farley, John Toohig and Randy Woodward about the upcoming pullback in lending which in their opinion hasn’t really even got started yet.

Per John, the only commercial real estate trading at the moment is for Trash and Trophies (likely the name of my next post :) and despite MSM narratives trouble is on the horizon. Miss this at your own risk.
Reference articles for this week:
Big commercial real estate downturn could sink 300+ banks: Report | American Banker
Westfield Gives Up Downtown San Francisco Mall (sfstandard.com)
Goldman Sachs CEO Solomon warns of commercial real estate write-downs (cnbc.com)
Hotel Owners Start to Write Off San Francisco as Business Nosedives - WSJ
And ICYMI last week:
Sunbelt Construction Boom Threatens Top Apartment-Building Owners - WSJ
US banks prepare for losses in rush for commercial property exit | Financial Times (ft.com)
Interest-Only Loans Helped Commercial Property Boom. Now They’re Coming Due. - WSJ
Coming soon: YouTube later today and hoping to do a few deep dives in the next month on commercial real estate, Airbnb and demographics (6/26). Stay tuned!
Reference
Airbnb
(AGAIN - Crossing fingers April/May Airbnb data will be out next week)
Inside Airbnb has published its data for March and in many cities there were increases month-over-month for listings after significant decreases the previous month. A good example is Austin which went from 18,337 listings in January to 13,808 listings in February and now up to 14,368 listings. Based on my travels I would say that a good chunk of people still think it’s 2021, especially the fix and flippers who may have been constrained by labor or supply chain issues and are coming late to the party. It will be very interesting to watch this trend for sentiment changes post the mid-March banking crisis and now subsequent credit crunch.
Some stats:
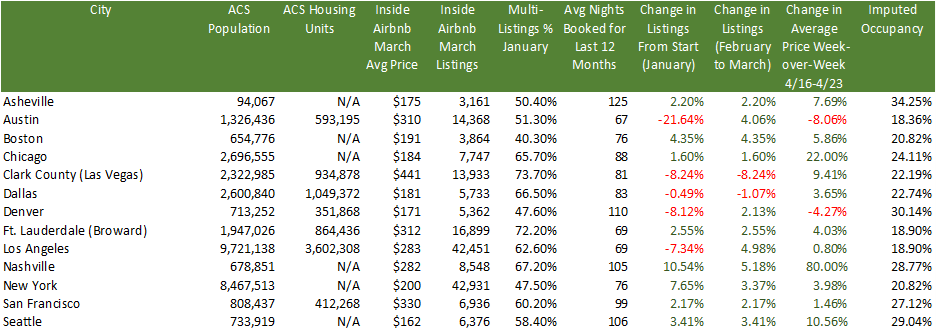
A really interesting stat above is the % of multi-listings per city. This metric represents the % of owners that list multiple properties, not just one. So, in other words, this will give you a flavor to how many investors operate in that market. The average for the cities above for multi-listings is 58.74%. So, despite what Airbnb said on that doozy of an earnings call when no one asked them about their miss in listings projections, their typical client is not someone who is trying to make just a little bit of extra cash. These are investors with multiple properties who are looking for passive income and likely bought these properties with DSCR loans or cash from loans on equity and crypto assets. And, with so many listings the imputed occupancy in these cities is very low and is likely no longer covering debt service cost.
For those who have listened to my Twitter Spaces (check out this one on Airbnb if you haven’t), you know my biggest issue with Airbnb is that besides excursions and nebulous technology improvements, adding listings is Airbnb’s only strategy for growth. I’m pretty sure there is a limit to how many hotel rooms and Airbnb listings we need in each city.
Rents
Rents are cooling from their meteoric rise and this week we see some interesting shifts:
Top Cities with Highest % of Average Rent Price Decreases (April-May)
Destin -7.01%
Rosemary Beach -6.28%
Orlando -4.66%
Winter Garden -4.66%
Costa Mesa/Los Angeles/Ventura County -4.05%
Top Cities with Highest % Increase in Vacancy (April-May)
West Palm Beach 1.00%
Cleveland .60%
San Jose .60%
Knoxville .50%
Tampa .40%
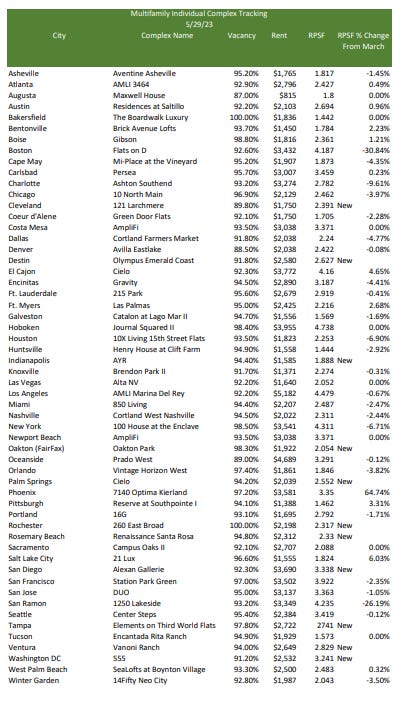
Top Cities with Highest % Decrease in Rent Per Square Foot (RPSF) for Specific New Multifamily Complexes (March-April)
Encinitas -3.57%
Ft. Myers -3.56%
Asheville -3.20%
Tampa -1.76%
Boise -1.09%
Redfin - Homebuyer Searches
I recently discovered this on Redfin’s website. Although searches certainly do not translate into purchases I think it is an interesting metric similar to consumer sentiment. As mentioned above, we need to be looking at more data instead of less, but none of it should be considered in isolation.
Cities with the Highest % of People Searching to Move INTO that City
Los Angeles, Costa Mesa, Newport Beach, Palm Springs 6.0%
Chicago 4.0%
Seattle 4.0%
Cities with the Highest % of People Searching to Move OUT of that City
Tucson 61%
Destin 49%
Huntsville 41%
Asheville 39%
Demographics
The demographic story has been one of the biggest drivers of narratives in the media. Unfortunately, those narratives are conflicting and source-dependent. I’m working on a full post comparing Census, NAR, UHAUL, United and I finally found some cell data so hope to have some time to work on this soon. And, the 2022 vintage for the Census has been recently published, so updated figures here soon.
ACS Population Change from 4/1/20-7/1/2021
Top 3 Cities with Highest % of Positive Population Change
Ft. Myers +7.9%
Bentonville +4.8%
Coeur d’Alene +2.5%
Top 3 Cities with Highest % of Negative Population Change
San Francisco -6.7%
New York -3.8%
Boston -3.2%
Cities with the Lowest Inflation-Adjusted Median Average Salary
Knoxville $50,245
Augusta $52,286
Johnson City $53,572
Miami $54,273
Tucson $54,498
Ft. Myers $58,607
END
Years ago, I went to real estate "school” in Scottsdale, AZ. I topped my class. Over the months past, I’ve read articles written by Melody Wright and watched videos. I find that I’m appreciating more about property, investment, ownership, etc. than I managed to learn in my structured school setting.
Thank you Melody. …and, YES, Melody I thank you for your genuinely Christian efforts towards victims of hurricane. In addition to your usual job of educating the public about real estate, you’ve increased your workload by helping to heal the wounds afflicting so many Americans.
Hi Melody -
First - I found you on Coffee and a Mike - loved both your episodes. Grateful someone is giving people like you plenty of time to talk in depth.
Second - my husband and I are debt free. We would love to but some land now and sit on it for ~5 years, pay it off, and eventually build a small home. Looking in the north / north west rural Florida area and TN.
I understand that buying a home right now is not wise. But does that extend to land?
Also - are there people you recommend someone follow to learn about land, homes, HOA issues, etc.?