
Can You Feel It?

From sales to delinquency, something has shifted in housing. We’ve seen an ever-increasing number of cities with YoY price declines over the past four seasons as well as a steady rise in delinquency, but with each new print this year the data has put yet another serious chink in the armor of the housing market. Depending on how you calculate it, the housing market makes up 12-20% of Gross Domestic Product (GDP). What happens in housing really matters to the economy. In some respects, housing has been the only thing besides AI keeping things alive since 2023. Prices had started to come down in 2023, but then sales seriously stalled. Only those who could “afford” to play could transact causing those prices to remain high. If you couldn’t really afford it, the government lent a helping hand through the FHA program which has seriously gone off the rails. Sustained prices worked as a soothing balm, assuring homeowners that their purchasing power was still intact. Although transactions slowed to a crawl, mirroring the worst years of the last housing crisis, narrative prevailed.
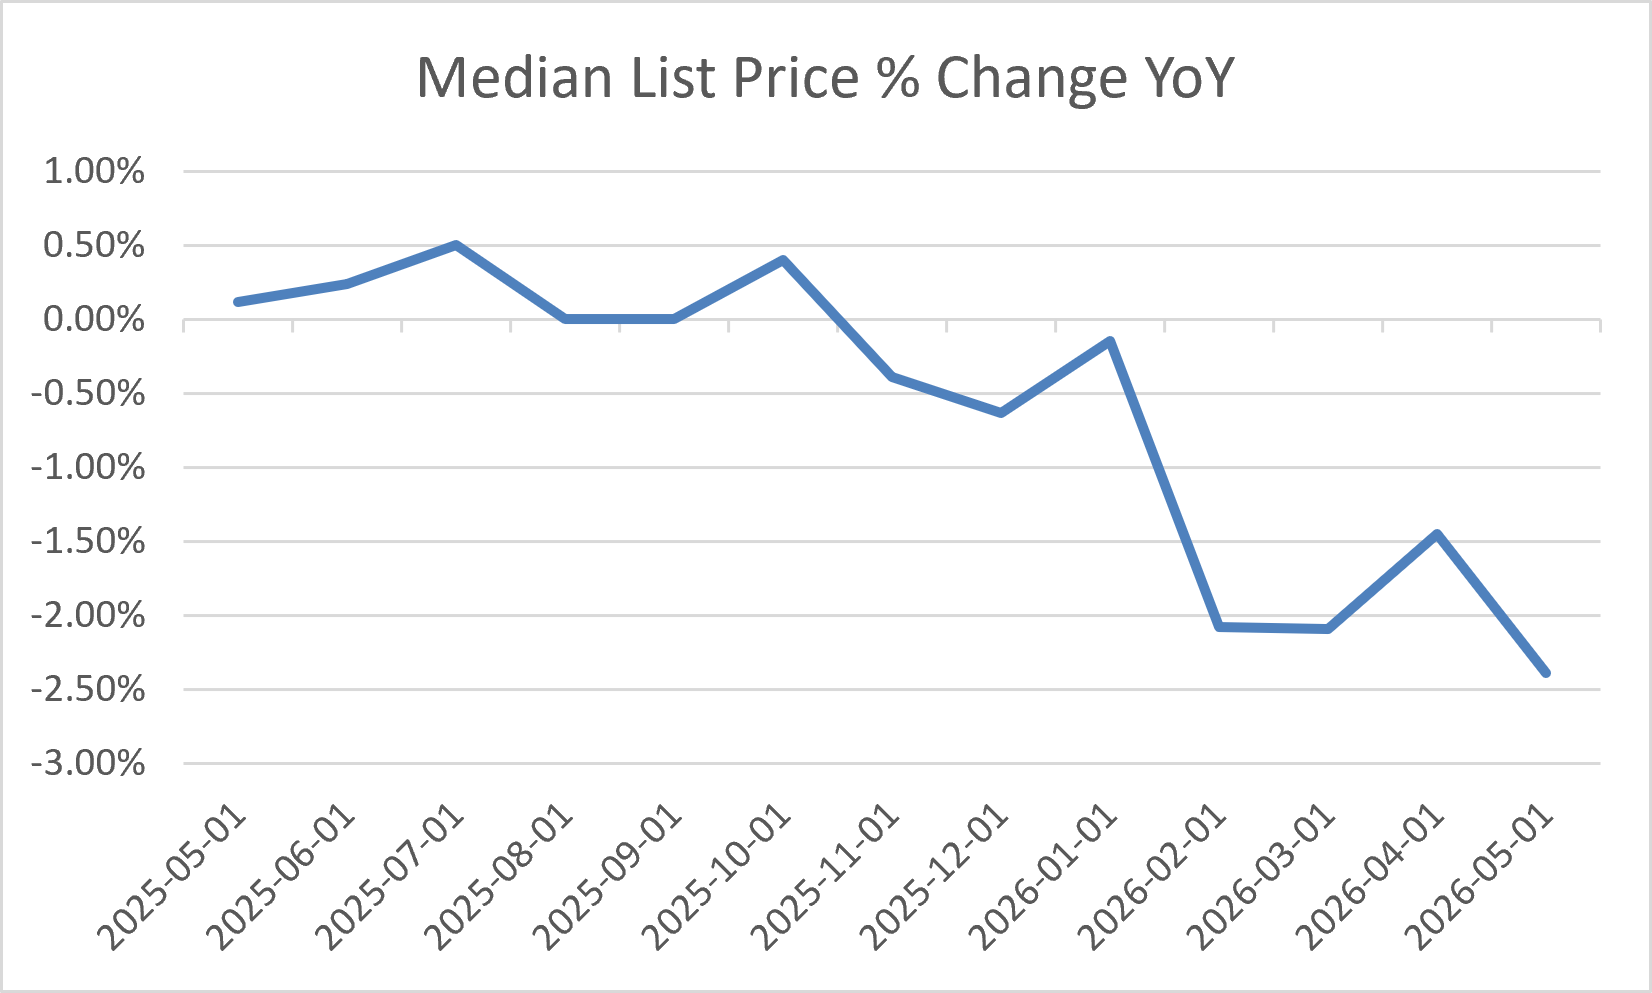
Last fall, we started to see several cracks in that narrative. Zillow announced that over 50% of homes on their platform had price cuts which averaged over 9%. Various industry participants started to change forecasts and rate outlooks. After Realtor restated list prices so June stayed positive in 2025, we saw the median list price go negative YoY in November, and it’s stayed there.
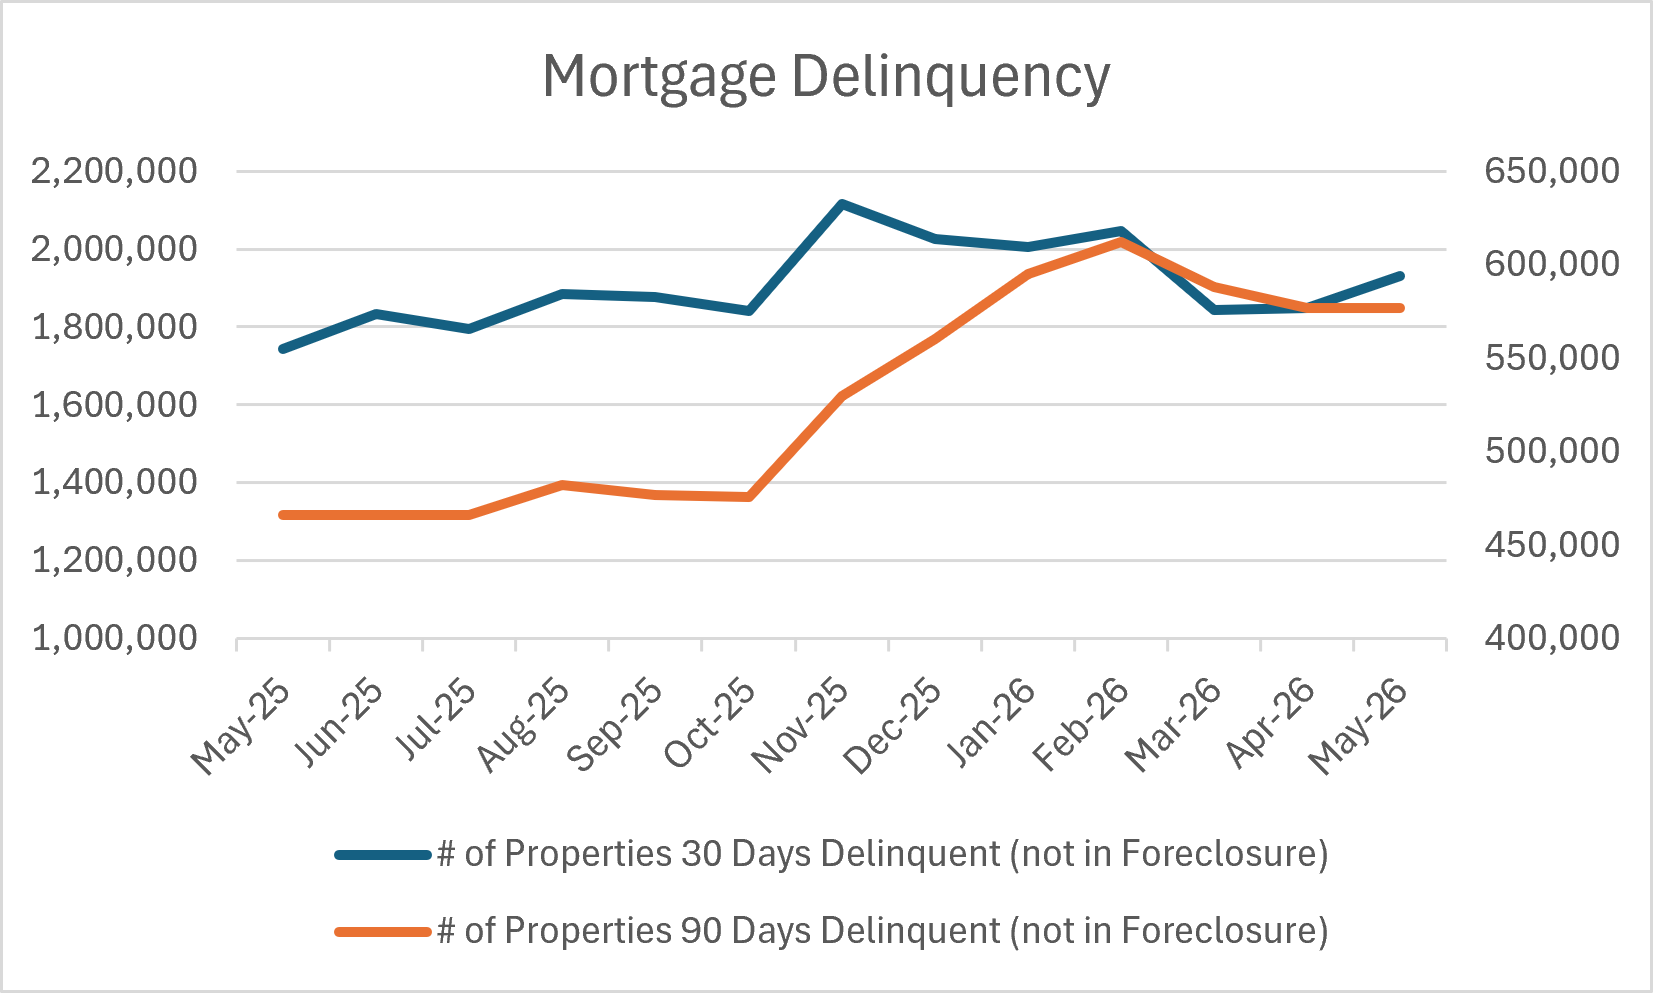
Then there’s the spikes in delinquency. Based on all the celebrating around increased tax refunds I was not expecting to see unseasonal behavior there. We had also been told that a core goal of the administration was to keep gas prices down. With the midterms looming it looked as if we might crawl on what are now very bruised hands and knees through yet another year of depressed sales and frozen prices. You all know what happened in late February which accelerated distress, resulting in early-stage mortgage delinquency.
Source: ICE/Black Knight
That we are seeing 30-day delinquency increase is the signal, especially in the spring. Americans do whatever it takes to save that credit score until there is nothing left to do. Early delinquency is the kind of delinquency that makes the industry very, very nervous. It means that distress is increasing across the system. The first time we saw that significant stress was in the FHA book in June of 2023 which prompted the Biden administration to create those very aggressive loss mitigation options that staved off trouble through the election. The problem now is that you risk stability to the whole securitization system if you try to do anything further. It’s a Ponzi scheme, and you cannot gamble on the gamblers getting spooked about disappearing liquidity. I’ve come to believe as well that there is awareness that the FHA program in particular was widely used by investors fraudulently.
Additionally, the material increases in serious delinquency John Comiskey and I have been warning about for over a year have arrived on the scene. Turner announced limitations on the FHA Covid relief options in April of 2025, and as John and I both said at the time, those changes would take time to roll through the pipeline. Through John’s work and my review of industry data, we are observing an almost 50% failure rate on trial plans due to the new requirements. This is why in the above chart we are finally starting to see properties in the 90-day delinquency bucket increase. Previously, folks would just go back to the till to get another Partial Claim. While there may be additional intervention when things get bad enough it will likely take the form of state hardship funds backed by federal dollars. There will be a regulatory response as well that will slow things down, but we have reached the point where it’s no longer just the most vulnerable in distress. Distress in the prime books is the death knell, and the industry knows it.
As I’ve said ad nauseum, the housing market moves at a snail’s pace (until it doesn’t). I think as humans we often believe things should happen much faster than they do. We forget that actually a year is not a very long time at all. As I get older, I feel that absolutely. The past few years have flown by; the speed accelerating with each passing year. Would you believe there is a body of well-researched work out there that posits that the land (speculation) cycle takes 18 years to complete? Researchers from different centuries converged on this theory - often independently - when studying various countries and their booms and busts. This most recent paper is written by the brilliant Catherine Cashmore from Australia and covers over 250 years of historical evidence. Catherine sought me out after watching some of my interviews, and I’ve had the opportunity to speak to her multiple times. The basic premise:

Long-time readers will remember me mentioning the great book Bubble in the Sun which argues that the Florida land speculation bubble is what caused the Great Depression. Researchers who subscribe to the land cycle theory were able to call real estate busts such as 2008 with a great level of accuracy far in advance. I have much more research to do into the theory as well, but the evidence is compelling. Importantly, the paper provides an interesting framework through which to view our current predicament. One thing that has puzzled me greatly since seeing very, very obvious signs of the bubble in 2022 was just how long the narrative around rising home prices has sustained. Although we have touched on it often here, I don’t think I realized just how much the AI/data center story is a land/real estate story.
The years immediately following the mid-point recession often show some of the strongest increases in land values, building activity, credit creation and speculative behaviour. The mid-cycle downturn is therefore not a failure of the cycle, but an essential feature of it – a brief interruption that strengthens the conditions for the final boom to come.
Recessionary Phase (Years 15–18): The recessionary phase is the point at which the speculative bubble finally breaks. After years of accelerating land-price growth, increasingly fragile credit structures, and the widespread belief that property prices ‘can only go up’, a trigger event arrives that the system cannot absorb (my emphasis).
It’s hard to remember the mid-point recession of this cycle as the response was immediate and overwhelming, setting up for the final push. I remember working at a tech company in 2019 after leaving mortgage proper to help them create a data center directory.

Every company in corporate America is required to have a Business Continuity Plan which necessitates back-up locations for data and operations. For some time, building these colocations were all the rage, but then more and more institutions started using cloud services and work-from-home technology for operations. Instead of having to work at a colo site, after Covid, you could simply boot up from home. Although in banking it took time to convince many to use AWS or Azure, once they adopted it, they did so quickly. No longer were those old server farms necessary. AI enters the scene and puts data centers back into play. However, that growth has started slowing as well. I’ve discussed in my post about New Albany and in various other past deep dives just how much the speculation in housing centered around the speculation over tech. Many of our boom cities were birthed on the back of tech, claiming they were the new Silicon Valley. Austin, anyone? And the list goes on and on from Denver to Charlotte to Syracuse to mention a few. These two narratives worked to reinforce one another on the way up, increasing “wealth effects”…it is looking they will do the same on the way down.
The Bank for International Settlements (BIS) published a warning recently in a paper entitled “Progress and Peril.” The BIS argues that over the past twelve months conditions have worsened. While the economy absorbed the tariff shock, the conflict in Iran has “cast shadows over the global outlook.”

The BIS noted that previous episodes in which very large sums were quickly invested in new technologies-such as canal construction in the 1830s, British railways in the 1840s, electrification in the late 1920s and the dot-com boom of the late 1990s-all led to busts with severe consequences.
While the early stages of AI development were largely funded internally, the increased scale of investment plans has led to a greater reliance on borrowing. That means that a bust could destabilize the financial system, particularly since it could spread to firms that build data centers and supply hardware.
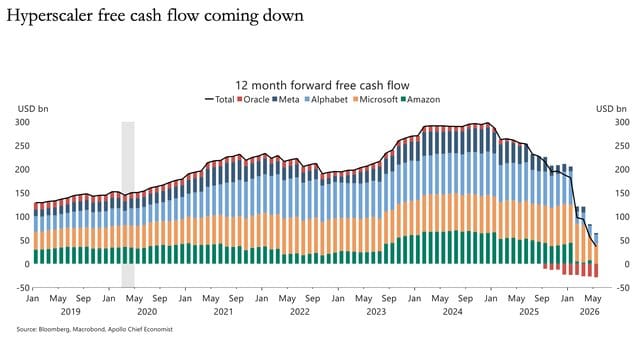
The hyperscalers were funding with their own cash, but their wallets are getting light. Those above-referenced historical, speculative booms such as the railroad buildout are also discussed in the Land Cycle Paper. In the months to come I will be studying the land cycle in more detail to understand exactly where we are. Prices did not bottom until 2012 during the last cycle, but YoY corrections started in March 2007. The prior land cycle correction started in November of 1990 and bottomed in December 1991. Due to all of the intervention post the GFC those prices took longer to bottom so I want to spend a good deal of time studying prior cycles. My gut tells me we may be in late year 17 or even early 18 as the cycle is actually 18.6 years. Watching all the signals converge that we discussed above tells me that we are further along than year 15, but I will know more after studying this in depth. At a minimum the land cycle theory is just another lens, another perspective which informs, deepening our understanding.
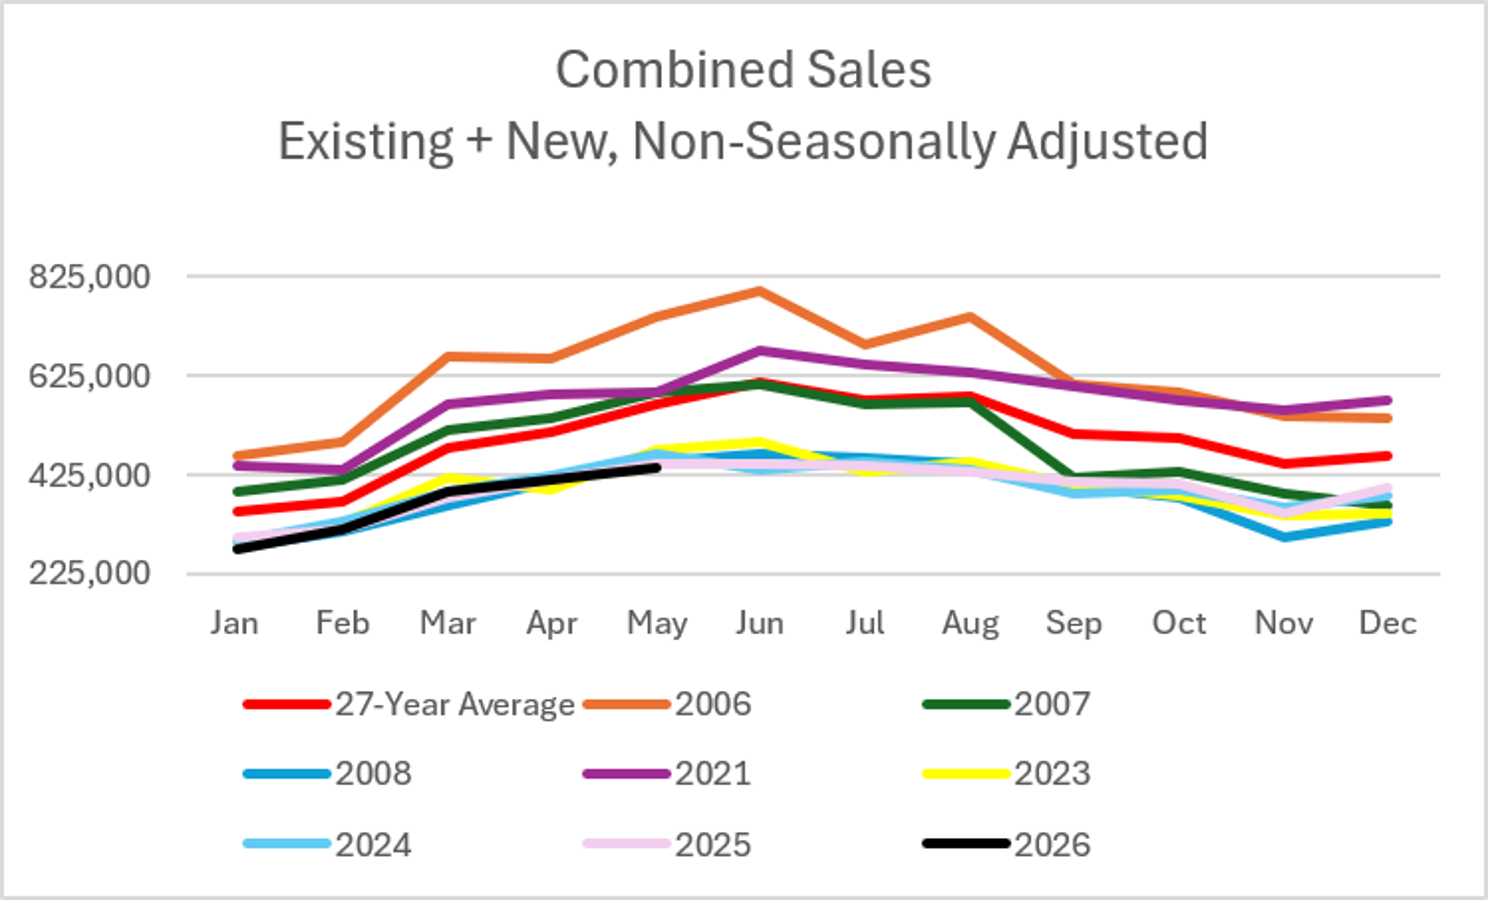
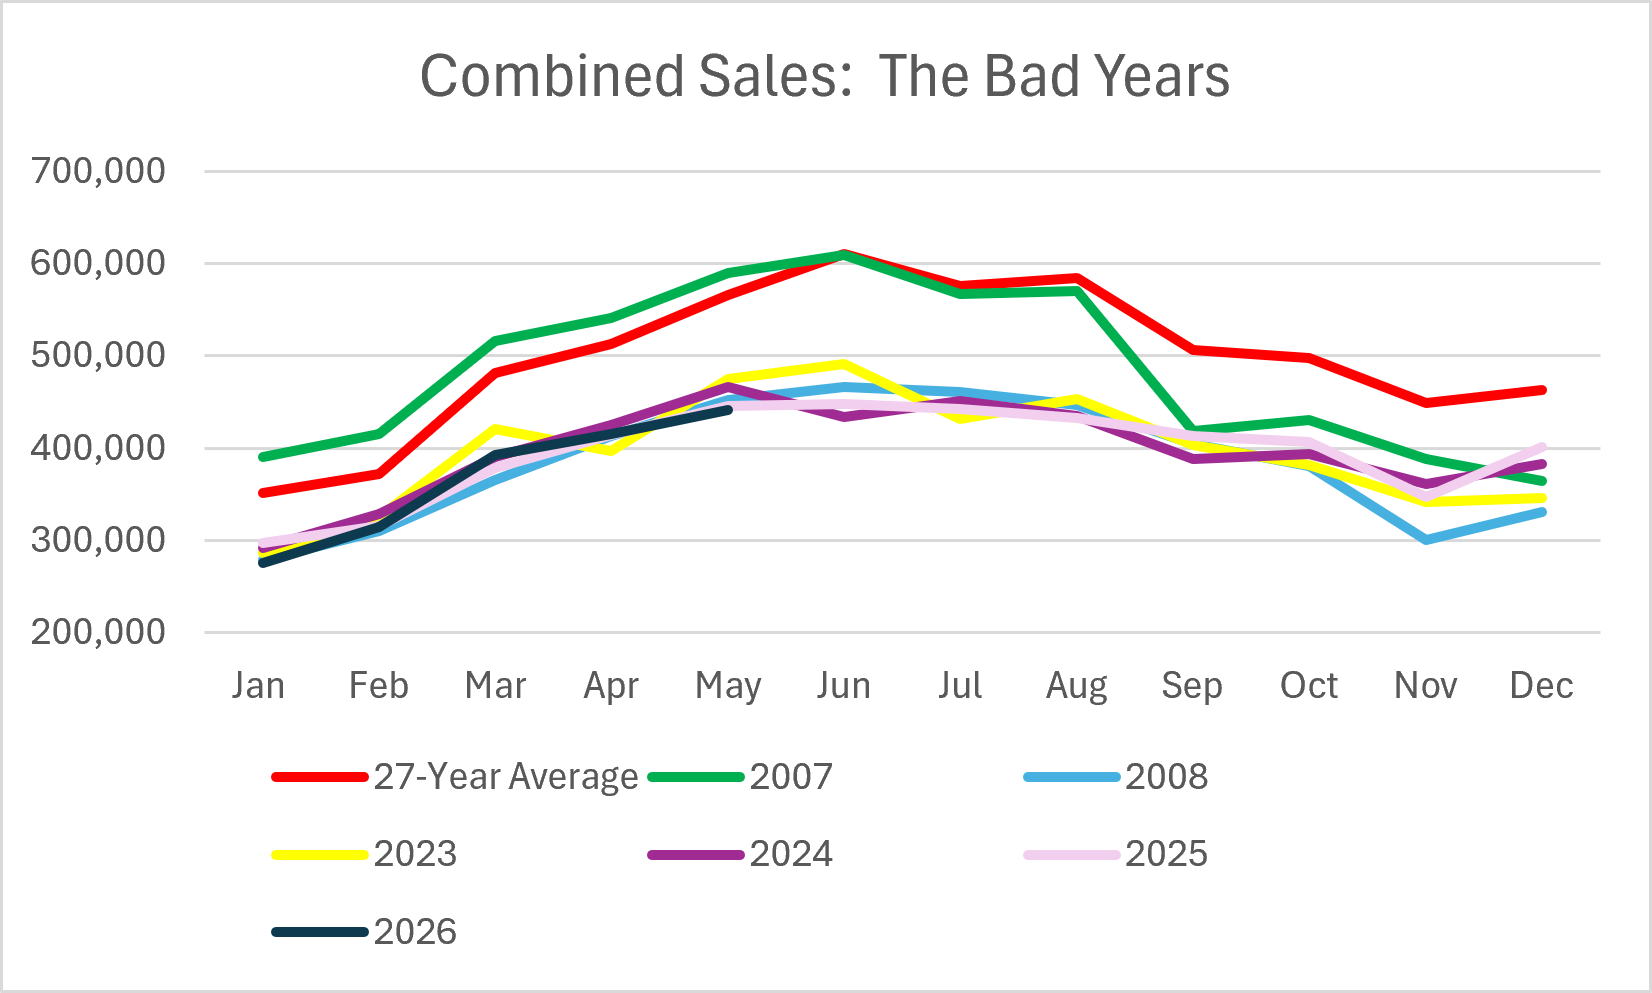
Last week was action-packed so you may have missed new home sales. Those results reinforced what we saw on the existing home sale side: the 2026 selling season has been a real dud. Combined sales (existing + new) are running -0.76% behind 2025 year-to-date (YTD). You know, 2025, the lowest year for existing home sales going back to 1995? Today Case Shiller for April came in negative MoM seasonally adjusted, and the FHFA price index also showed a MoM decrease...during the season. As I said in a post on xTwitter, seasonality has taken a backseat for both delinquency and home prices. In addition to receiving new home sales data last week, we had much drama around the signing of a rare bipartisan bill on housing. Below I will share my thoughts on the drama and that bill as well as other proposed legislation which all worked to keep XHB 0.00%↑ from tanking after new home sales results. Lennar learned last time that cozying up to Washington was the play. Based on these new home sales results analyzed in depth below, the builders have dark winter(s) ahead. After today, the selling season and Q2 will be in the rearview. New York, Philadelphia and Pittsburgh joined Boston and hit their highest listings for sale in my tracking last week. I started my weekly tracking in January 2023. I of course review those inventory levels in historical context, but this signal tells me that homes are not clearing. Instead, inventory is building which has meant elsewhere lower prices are on the horizon. With the season behind us, watching inventory levels will be my summer pastime. Finally, I will provide an update on private credit which is again in the news as well as discuss an interesting Fed paper on the leveraged bets in the Treasury market.
Let’s begin…
