
Condo Crisis 2.0?

The Case Shiller home price index for May 2026 was released today, and seasonally adjusted, the series was down again Month-over-Month (MoM) for the third month in a row…in the selling season. The annual increase was 1.1% and up from last month’s 0.9% increase which should be expected during the spring. As a reminder, the Case Shiller is a three-month average, so May includes sales from March to May and contracts from as early as January. Based on what I’m seeing with Redfin national data we can expect the series to continue to see modest Year-over-Year (YoY) increases until we get deep into the Fall. That the index is being seasonally adjusted down MoM is a signal.
After adjusting for seasonality, the National Index declined 0.05% month over month, while the 10-City and 20-City Composites posted modest gains of 0.3% and 0.2%, respectively. The gap between the NSA and seasonally adjusted results underscores the extent to which seasonal factors are supporting headline price growth. Even where prices increased on a seasonally adjusted basis, gains remained modest and were negative in real terms.
My readers know that I’m not a fan of seasonal adjustments except as clues for what we are “supposed” to think about the data. Otherwise, you just get caught up comparing forecasts and not what actually happened. For my tracker, I always use the non-seasonally adjusted (NSA) numbers. From April to May, the MoM increase decelerated in the non-seasonally adjusted series from a 0.83% MoM increase from March to April to a 0.64% increase from April to May. Since the series started in 1987, the average increase from April to May is 0.91%. The average from 2007-2011 was 0.52%. In 2009 it was 0.84% which is higher than this month. In fact, since 1987, there have only been 10 Mays with lower YoY increases in May.
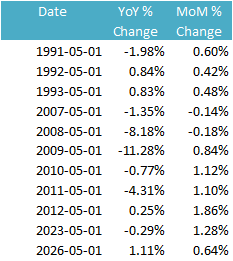
Remember how I mentioned that the previous 18-year cycle prior to GFC was in the early 90s? I promise to write more about that cycle soon, but no matter which way you slice it, these results show a picture that is deteriorating. Importantly, as noted in the quote above, home prices are down in real terms as the YoY increase is below the rate of inflation. I don’t spend a lot of time talking about that as the price you will have to pay is what matters most, but it is important to remind everyone on occasion.
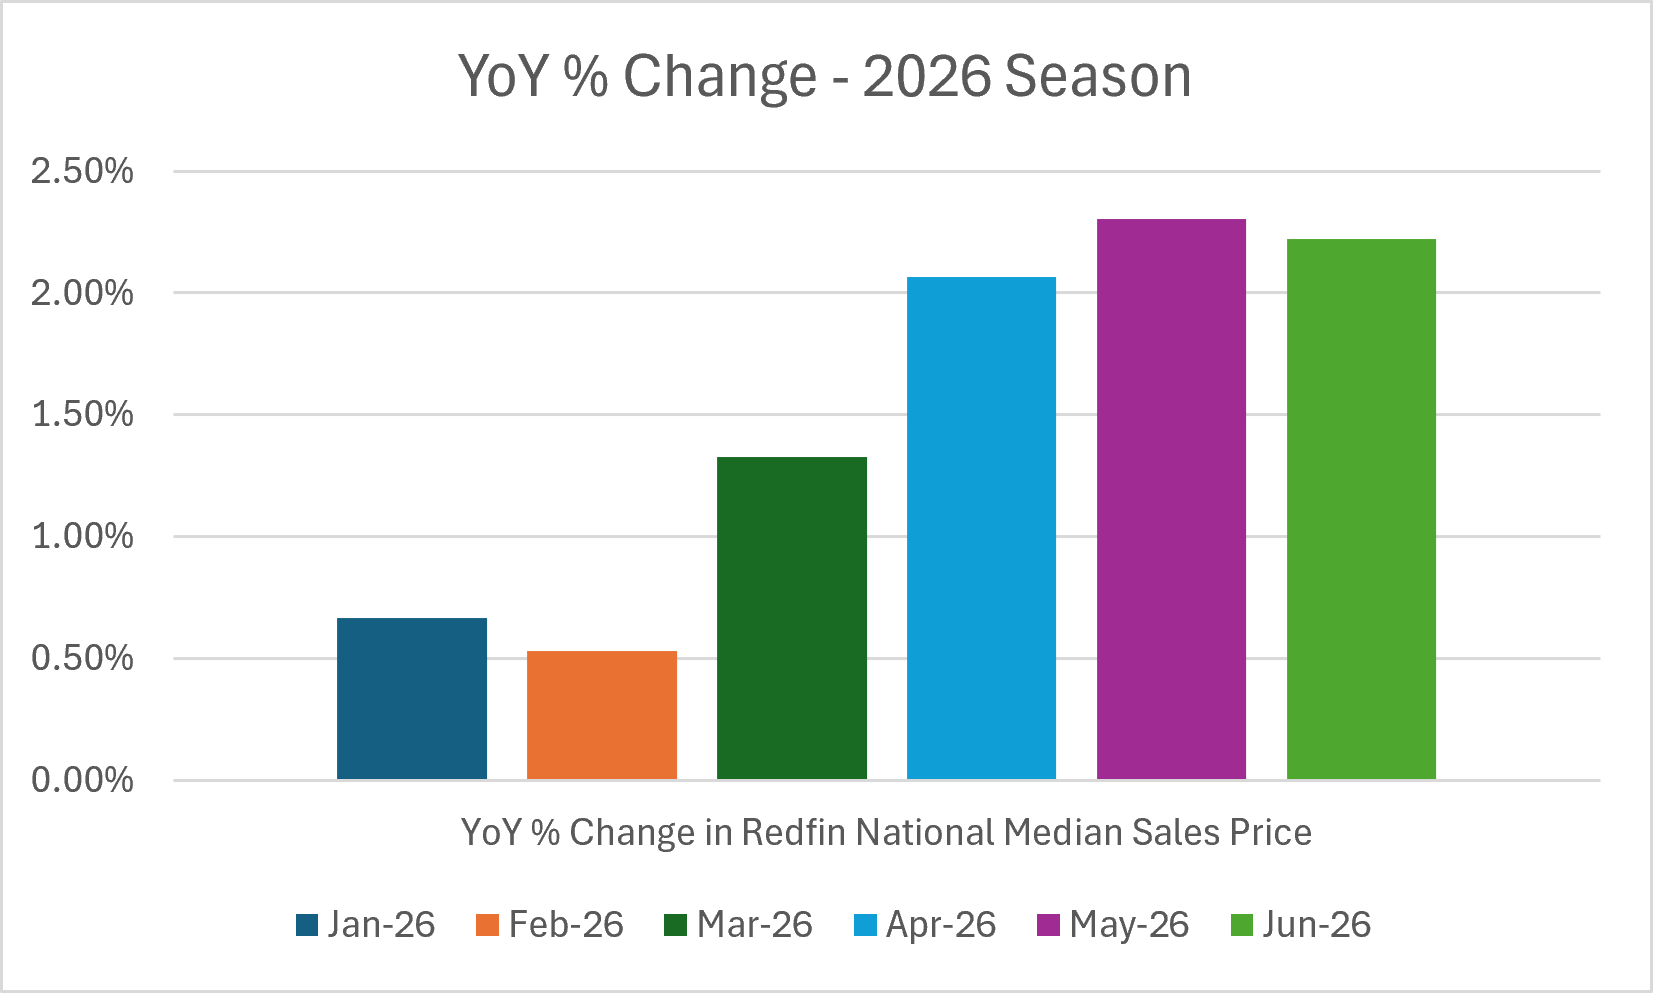
In the M3 Series which includes the 86 markets I track, we saw less seasonal price firming in June than we did in May (+1.48% YoY in June versus +1.85% in May). You could see the weakening in the Redfin national numbers as well although the decrease was a bit less (+2.22% in June YoY versus +2.30% in May). Likely the Case Shiller results will still be positive for June when they are announced in late August but slightly less positive. The largest gains we saw in the Redfin national series were from March to April with additional YoY firming in May albeit at a slower pace. I know that’s a lot of numbers, but in summary, it is unusual to see this type of weakening during the season.
You know what Case Shiller does not track in its series? Condo sales and prices. Why does that matter? In some markets, we have seen significant price declines from their recent peaks. Nationally we have seen sales materially decrease from their 2021 peak. That bloodbath could get much worse for a host of reasons, but one reason is due to a recent change by the government-sponsored enterprises (GSEs) to their approval guidelines. Before we go there, we must first talk about those new home sales which were released late last week. For those of you who are signed up for my breaking news alerts (you can sign up here), you already know that those new home sales results were underwhelming though the media managed to eke out a positive spin based on a head-scratcher of a seasonal adjustment this month. Sales prices, however, did not enjoy any positive spin.
Speaking of questionable headlines, Black Knight/ICE came out with a doozy (discussed below) to try and whitewash June mortgage delinquency results even though the numbers were whoa. That YoY increase in foreclosure starts should have been the headline. If you are a frequent reader or even consumer of my YouTube appearances, you know that since last Fall I have been saying we would start to see material increases in June. And, we did. Again, we are coming off a very low floor, but what’s important is the direction.
So, how bad were those new home and delinquency results exactly? What does the current state of the condo cycle tell us about where we are going and how this GSE change may impact that market and accelerate price declines? I will share key market stats for condos as well as give you context on their importance. Condos played a large role in the crisis last time, and it looks like they will do so again. And, finally, I provide detailed, regional information for the M3 series. For the third time, one region again showed YoY price declines, and it is not in the South or West.
Let’s begin…
