
Data! Data! Data!
Done Dirt Cheap

Hello everybody and sorry for the delay. I’ve been lost in the valley of the shadow of Twitter and am running a bit behind.
But, after getting waylaid by arguments over data that the people arguing don’t even understand and being a Dodo bird for falling for some of their tricks, I am here to give you data that I compile on my own without the help of an army of analysts. All of this is done by lil ol’ me every single week on the cheap which feeds a larger model that I work to refine and augment.
I ask you my doubters, what data do you think I’m missing? Everyone is looking in the rearview and not at what is coming. And, although, I take into consideration all of that data as well (historical inventory, historical prices, 10-year movements, employment, jobless claims, interest rates, etc.), I am not here to give you the data you can get in the financial media or from the talking heads. If you ever feel you are missing such data, which I do include from time-to-time, please do reach out and I will either give it to you directly or point you to someone who focuses on it.
And, one final word on social media. Firstly, if you have reached out, and I have not responded, please give me some time to get caught up from the overwhelming response to my Wealthion video, most of which has been very kind.

And for those that were not so kind, I have successfully converted a handful which is always my goal - maybe not to fully convert, but to have them question their assumptions. For those of you who happen upon me going down those rabbit holes sometimes it may come across as stubbornness and silly (and sometimes it absolutely is), but it is usually driven by a real desire to find common ground - even with my worst enemies. Common ground is the only way we are going to get through this mess.
On another note, I also had a fun conversation with Michael Gruber, a new acquaintance and fellow GFC survivor, if you want to check it out.
So, without further ado, the weekly stats (monthly summary to be shared next week):
Listings for Sale
Listings for sale were up week-over-week by 2.81% and .86% to the average. Even HousingWire and Mike Simonsen said we are trending up when listings usually go down.
Top Cities with Largest % Increase in Inventory Week-over-Week (9/3-9/10):
Very interesting to see the NE show up here…very interesting. Please share if I’m missing a seasonal trend, etc. as I haven’t had time to dig in…
Hoboken 27.27%
San Francisco 14.68%
Boston 24.76%
Rochester 12.44%
Westchester County 10.33%
Top Cities with Largest % Increase in Inventory Compared to 11-week Average
Rosemary Beach 20.75% (#1 for 3 weeks in a row)
Westchester County 10.33% (up from #4)
Nashville 8.34%
Bakersfield 8.07%
San Ramon 8.06%
Top Cities with Largest % Increase in Inventory from Start (1/1/23)
San Ramon 121.67%
Coeur d’Alene 82.38%
San Francisco 73.99% (up from #5)
Denver 55.04% (down from #3)
San Jose 50.14% (up from #8)
Austin 49.77%
Galveston 46.84%
Rosemary Beach 45.44% (down from #4)
Portland 42.10% (up from #10)
Bozeman 40.04% (down from #9)
Top Cities with Highest % Increase of Single-Family Rental Listings (9/3-9/10)
Listings for rent went up 4.27% week-over-week and 4.93% to the average.
Cape May 100% (tiny amount of properties, but this is the most listed for rent in the past 13 weeks - end of summer likely)
San Ramon 16.28%
Rosemary Beach 15.38%
Sevierville 15.38% (yes, both were 15.38%)
Portsmouth 12.50%
Top Cities with Highest % Increase of Single-Family Rental Listings to 13-week Average
Cape May 108.70%
Rosemary Beach (up from #3) 38.46%
Encinitas 33.45% (down from #1)
Galveston 28.37% (down from #2)
Portsmouth 12.5%
Top Cities with Highest % Decrease of Single-Family Rental Listings (9/3-9/10)
Sacramento -5.52%
Johnson City -5.06%
Sedona -3.08%
Charlotte -2.47%
Rochester -1.80%
Airbnb/VRBO - Short-Term Rental
August data for average daily rate (ADR), listings and occupancy will be available next week, but keeping July info here until then. Weekly ADR info is current.
On average, short-term rental listings in the cities I track increased by 1.28% from June to July and 6.02% since January. These moves are consistent with what I’ve been hearing anecdotally on social media…there are still FOMO’ers jumping in, but the rate of that change is slowing from last year. From January to July of 2022, short-term rentals in these cities increased by 23.14%.
And, in looking back to 2020, STR listings have increased 42% since December of 2020.
Top Cities with Highest % Decrease in Average Daily Rate (ADR) Week-over-Week 9/3-9/10
San Francisco -26.06%
Oceanside -28.66%
Johnson City -37.90%
Chicago -35.03%
Tampa -32.72%
Top Cities with Highest % Decrease in Average Daily Rate Compared to 13-Week Average
Rosemary Beach -53.67%
Destin -40.52%
Ventura -39.11%
Oakton -35.52%
Miami -34.02%
Top Cities with Highest % Increase in Average Daily Rate Compared to 13-Week Average
BTW - only these 5 cities saw increases in ADR versus average….summer vibes are fading
Bentonville 76.83%
Augusta 9.38%
Nashville 7.90%
New York 5.74%
Brattleboro .84%
Top Cities with Highest Average Daily Rate - July 2023 (will have August next week)
Newport Beach $771.53
Westchester $744.91
Rosemary Beach $720.82
Cape May $592.29
Encinitas $576.17
Top Cities with Highest Average Daily Rate - July 2022
Rosemary Beach $799.85
Newport Beach $767.51
Westchester $619.46
Cape May $579.92
Encinitas $570.53
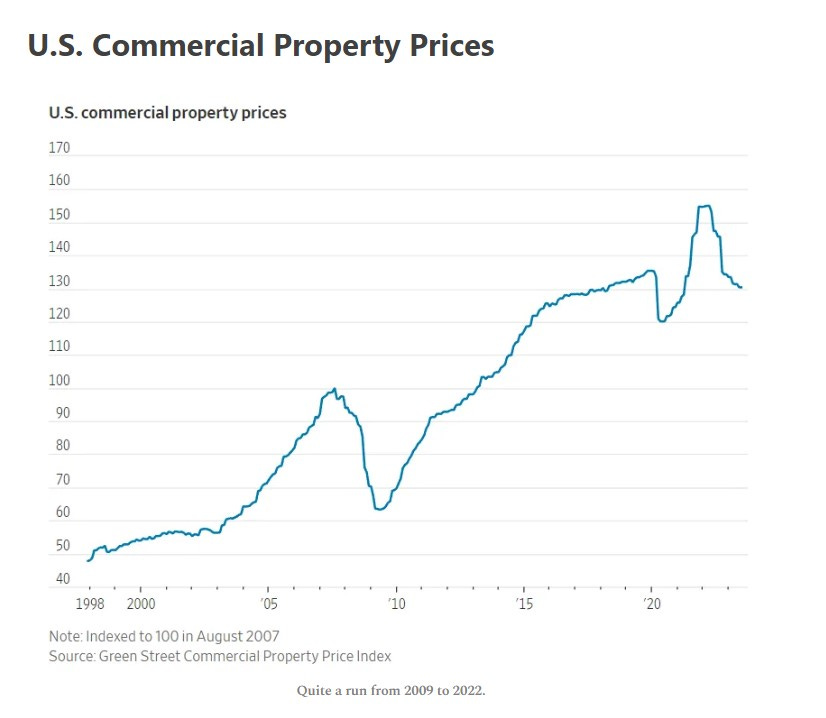
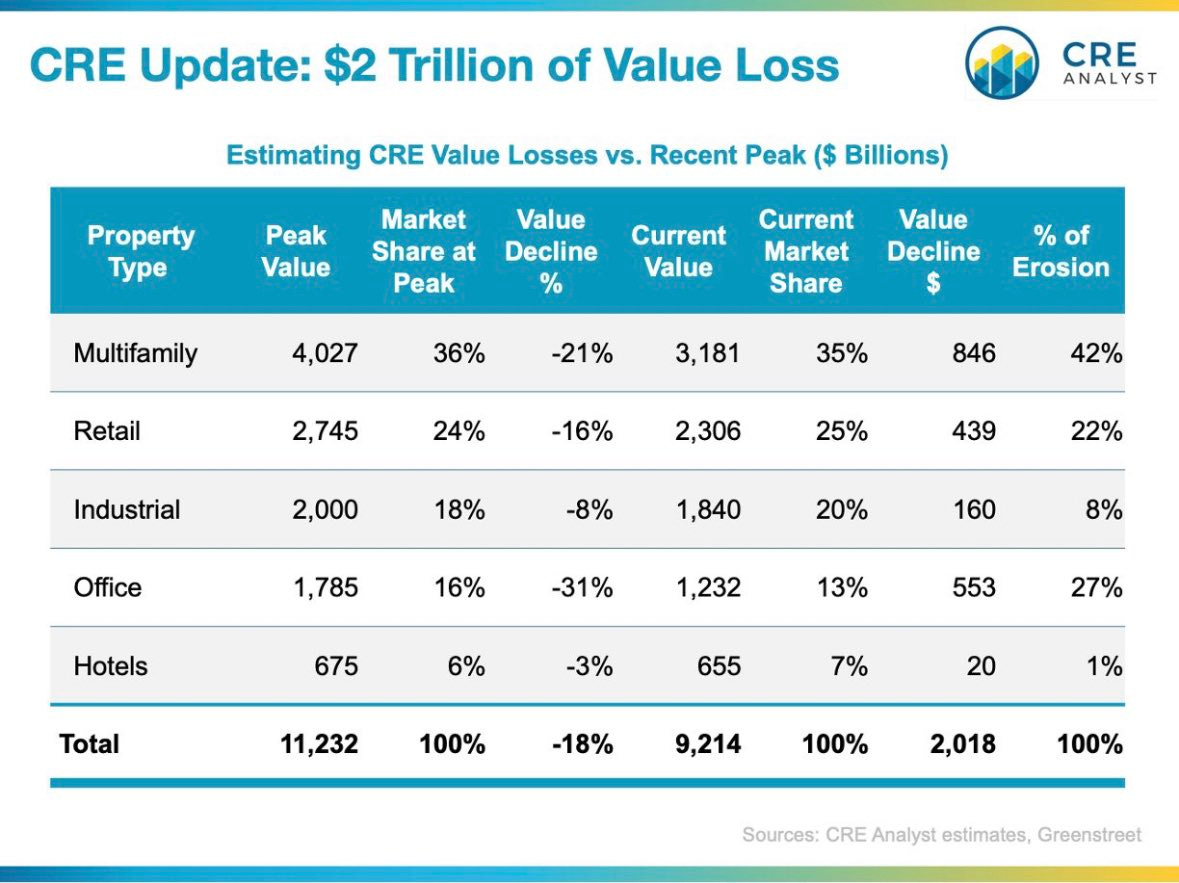
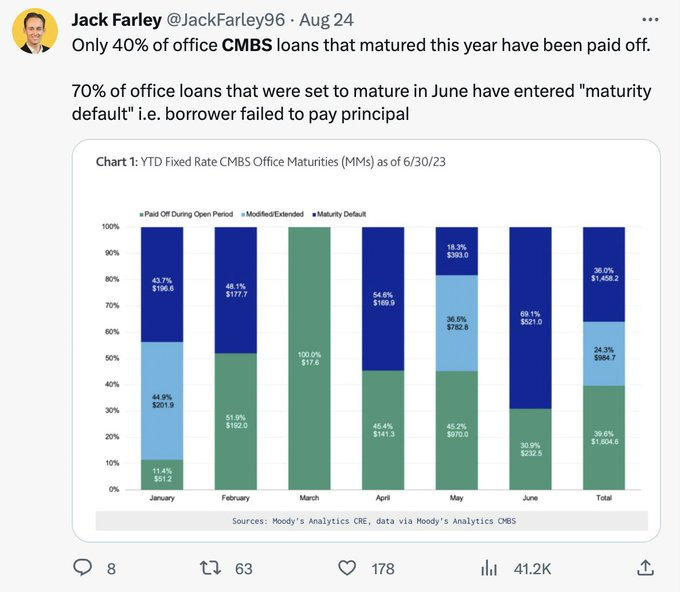
Commercial Real Estate (CRE)
Didn’t have a ton of time to focus on CRE this week, but what I can tell you is that there is a lot going on at the margin. Pay careful attention to all those “new” tech projects as well as exits….I think many markets are going to get burned. Headed to Port St. Lucie this weekend based on a YT viewer tip to see the carnage left by an Amazon project that is not happening.

Keeping some charts here for now as I think this will look much worse in a year.
Reference articles:
Here’s How People Are Returning to the Office Worldwide - The New York Times (nytimes.com)
Return-to-Office Is a $1.3 Trillion Problem Few Have Figured Out (yahoo.com)
Asset managers look to sell Hong Kong buildings as higher rates bite | Reuters
CIBC to focus less on US office real estate after profit miss | Reuters
Industrial Absorption Drops 67.3 Percent from Last Year (trepp.com)
Cannae Advisors, Morgan Stanley Buy $174M Debt Attached to Albany Mall – Commercial Observer
EY: Five Takeaways from a Recent Look at Office Trades - Connect CRE
Blackstone Selling 22% Stake in Bellagio to Cash In on Las Vegas Rebound - WSJ
Landlords With $1.2 Trillion of Debt Face Rising Default Risks - Bloomberg
Office Tenants Are Renewing Leases—but for Far Less Space - WSJ
Plunder: Private Equity's Plan to Pillage America: Ballou, Brendan
More articles linked below in the reference section below….
Coming Soon: Whatever I can manage :). It’s been a crazy summer, and I still have to make a living, so I will do my best over the next several weeks as I try to do more local Florida research and keep my finger on the pulse of macro.
Reference
Rent as well as market summary to be provided next week.
Rent
As mentioned here previously I have been struck by how little movement there has been using RealPages, but this month I noticed something interesting. RealPages started including some statistics in its write-up of each city including year-over-year changes in occupancy for all but a few key cities which is telling in and of itself. In case you haven’t seen this, RealPages is currently under investigation by the DOJ.
Average year-over-year decreases in occupancy for the cities I track and the cities that RealPages lists is -1.57%. Some of the key cities that are missing these stats in their write-ups: Chicago, Dallas, Houston, Nashville and Phoenix. Someone has shared a new source with me that I will be looking at next week as well.
Top Cities with Highest % Decrease in Average Rent June to July
Nashville -15.92%
Asheville -13.71%
Coeur d’Alene -11.88%
Destin -10.28%
Chicago -9.68%
Top Cities with Largest Decrease in Occupancy Year-Over-Year
Augusta -3.09%
Tucson -2.44%
Boise -2.30%
Atlanta -2.30%
Indianapolis -2.18%
Notable Mention: Miami - 1.91%
Airbnb/VRBO - Short-Term Rental (STR)
Top Cities for Short-Term Listings July
New York 26,809
Miami 14,502
Las Vegas 13,913
Los Angeles 11,765
Houston 11,588
Austin 10,911
Atlanta 10,879
San Diego 10,746
Orlando 9,763
Sevierville 8,816 (knocking out Nashville from June)
Top Cities with Biggest Increase in Short-Term Rental Listings Jun-July
Fort Myers 14.35%
Indianapolis 6.53%
Las Vegas 6.43%
San Diego 6.24%
Oceanside 5.32%
Top Cities with Biggest Decrease in Short-Term Rental Listings Jun-July
San Jose -6.37%
Phoenix -5.25%
Portsmouth -4.85%
San Ramon -4.30%
Tucson -4.16%
Top Cities with Biggest Increase in Short-Term Rental Listings Jan-July
Destin 37.32%
Coeur d’Alene 36.71%
Cape May 31.94%
San Ramon 28.99%
Palm Springs 22.49%
Top Cities with Biggest Decrease in Short-Term Rental Listings Jan-July
San Jose -21.04%
Dallas -18.02%
New York -13.39%
Fort Myers -11.82%
Houston -8.53%
Top Cities for Short-Term Listings July
New York 26,809
Miami 14,502
Las Vegas 13,913
Los Angeles 11,765
Houston 11,588
Austin 10,911
Atlanta 10,879
San Diego 10,746
Orlando 9,763
Sevierville 8,816 (knocking out Nashville from June)
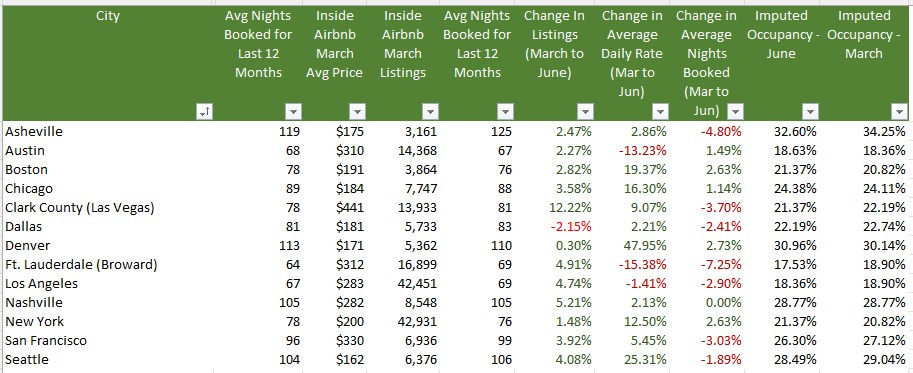
From Inside Airbnb
As I’ve mentioned previously all data is not equal. Inside Airbnb has incredible data, but it is only for a handful of cities and is published once a quarter. Their listings tend to be much higher than the data provided by AirDNA and others, but they trend in the same direction. In October I will do a deep-dive on the differences and trending so we can see how closely the myriad data sources track. But, for example, Inside Airbnb data shows Nashville with 8,993 listings at the end of June while AirDNA has 8,105.
Only one city in the cities they track- Dallas - showed a decrease in listings from March to June which was likely due to the recent legislation. As the stock market took off so did everyone’s hopes and dreams. Unfortunately, I believe that not only will legislative efforts start to tick up (Airbnb’s lawsuit against NYC was dismissed last week), but the sentiment will likely sour in the next months based on macroeconomic clouds that are gathering.
Historical & Monthly Comparisons
Lowest Occupancy July 2023
Augusta 55.33%
Winter Garden 51.40%
Palm Springs 52.02%
Phoenix 54.68%
Sedona 54.60%
Lowest Occupancy July 2022
Palm Springs 50.45%
Sedona 50.93%
Tucson 52.00%
Phoenix 53.78%
Augusta 55.33%
Highest Occupancy July 2023
Destin 91.44%
Newport Beach 91.21%
Cape May 90.50%
Rosemary Beach 88.91%
Oceanside 88.87%
Highest Occupancy July 2022
Cape May 93.39%
Rosemary Beach 89.34%
Destin 88.97%
Westchester 87.17%
Oceanside 87.17%
Commercial Real Estate
Going to keep this incredible podcast with Jack Farley, John Toohig and Randy Woodward in this section until they do the next one - it’s just that good.

Per John, the only commercial real estate trading at the moment is for Trash and Trophies and despite MSM narratives trouble is on the horizon. Miss this at your own risk.
Additional Articles
Loop landlord files for bankruptcy ahead of foreclosure sale | Crain's Chicago Business
Google Looks To Offload Another Big Office Campus in Silicon Valley (costar.com)
WeWork Risk Seen in Commercial Mortgage Bonds, Barclays Says (yahoo.com)
Big Banks Are Trying to Dump Commercial Real Estate Debt As Pressure Mounts (businessinsider.com)
The Commercial Real Estate-Small Bank Nexus | ZeroHedge
Local Malls, Stuck in ‘Death Spiral,’ Plunge in Value - WSJ
Troubles for Wall Street office tower worsen as foreclosure looms (nypost.com)
Understanding the challenges in the U.S. commercial property market
Commercial Property Investors Huge Office Bet is Unraveling In London, New York and Paris
Commercial Real Estate Reset is Causing Distress from Sand Francisco to Hong Kong
CRE’s Strains are contained: But in a recession the dam won’t hold. (contained you say?)
Big commercial real estate downturn could sink 300+ banks: Report | American Banker
Westfield Gives Up Downtown San Francisco Mall (sfstandard.com)
Goldman Sachs CEO Solomon warns of commercial real estate write-downs (cnbc.com)
Hotel Owners Start to Write Off San Francisco as Business Nosedives - WSJ
Sunbelt Construction Boom Threatens Top Apartment-Building Owners - WSJ
US banks prepare for losses in rush for commercial property exit | Financial Times (ft.com)
Interest-Only Loans Helped Commercial Property Boom. Now They’re Coming Due. - WSJ
Being newish to your writing I just wanted to say thanks for sharing all your wonderful research, I'm loving it!
A longish comment, apologies in advance. In your CRE data, the least impacted was Hotel and Industrial. I found that interesting. I am in a GP that is doing CRE development in Mexico. Hotel, Office and Multi res in Mexico City and Industrial in Guadalajara. Started about 2019. I don't have current market rate of change information or detailed market information but can say based on financial reporting our Industrial is on profit targets, Hotel looks very promising while we are suffering in Office and Multi Res is so so. Office we are looking to dispose of and focus more on Industrial in Guadalajara. The Multi res in Mexico City is rebuild in place as there is no new land there. I suspect that the same issues with inventory oversupply you are describing in the US are part of the issue in Multi Res as many Mexico City neighborhoods are gentrifying and sales are slower than expected. I am also doing different LP's in Toronto, Canada starting in 2017 which are single family and multi res/purpose built rentals. We are not seeing the high inventory issue you describe there. We have severe issues on cost with fees, up to 25% of total unit cost and zoning/permits up to 4 years in approval. One 245 single house development is 2 years late as we are only granted partial building permits but the houses are occupied as soon as we finish whatever build the city allows. Opposite problem to what you are finding on your road trips. Length of approval is long enough it yields a business model funding the zoning process on multi res urban densification projects and then selling the zoned property to a developer which we are also doing. I am very interested to follow your work and look for parallels I can apply to Canada and Mexico. Finally I am in another LP that is US centric and your CRE profile fits the most recent financial updates where we are already significantly reducing return expectations. Thanks for the hard work!