Hidden somewhat between the beach and I-95, I managed to find a more amenable side of the Miami area this past weekend as promised. In every city there are pros and cons, good and bad, those that have and those that do not. So, no matter how negative these posts may sound at times, it is not my intent to suggest that we abandon these cities. Rather, I hope that we come to understand them beneath the hype and narrative. And, if we are a local, and this is our home, then we should fight for them as well.
Thanks to an incredible post on Twitter by local, native-born, Floridian, Kristin, I found myself this weekend at an inviting raw bar which touted zero pretense but plenty of warm welcome. Before touring a local neighborhood, we spent several pleasant hours watching those with lots of pretense try to tipsy dock while talking all things housing - an exceedingly good time.
I felt thankful for the waitress who gave us tips on how to save $$ when we ordered and who had a wink and a smile each time she came by the table. Very different from the dark, more upscale, chophouses and lobster bars I’ve visited here where no one was smile-smiling and the staff seemed stiff and afraid of the next a-hole that would surely be coming in for fare. But, as much as we enjoyed ourselves there were signs here too that unless things turn, this little dive bar could potentially be driven out by those forever in search of holy yield and the capture of the imagination of the aspirational.
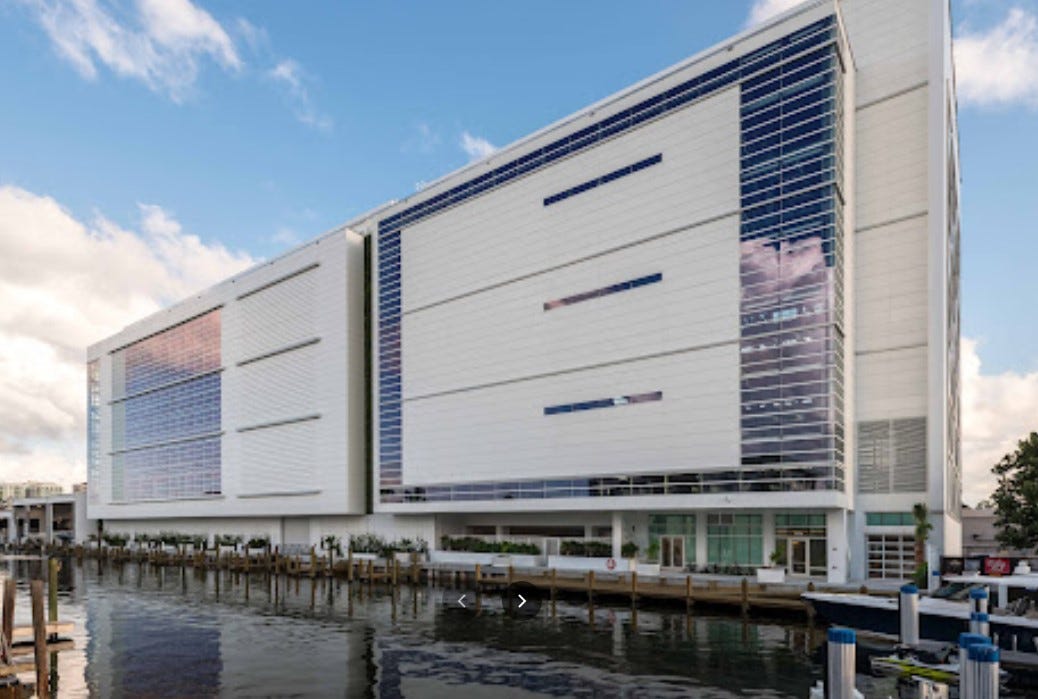
“Join the elite…and elevate your boating experience,” the website says of a new drydock storage facility blocking the view off the patio of my new favorite raw bar, advertising
advanced, computerized crane technology allowing us to store boats up to 46’ quickly and safely in a hurricane-protected building. Our lift can store or retrieve a single boat in less than 5 minutes. After you’ve enjoyed your day on the water, your motors will be flushed and safely stored until your next adventure. Have peace of mind knowing your boat is safe, secure, and conveniently available whenever you wish to use your watercraft.
Looks pretty cool and futuresque in the pic above, but here is another view.
The buildings on the other side of the canal are modest apartments and homes who once could see natural light but now stare into what looks like a large file cabinet.
Things change and such is life, you may say, but I say let’s revisit this spot in a couple of years after the investors who have driven up home prices so significantly tuck tail and abandon this area yet again. As some of you may know I spent a good deal of 2012 and 2013 in Florida trying to manage the severe default crisis. We have been here before and not just in the GFC. I highly recommend Bubble in the Sun which goes so far as arguing that the great land grab in Florida largely led to the Great Depression, if you think this is somehow different this time.
In Q1 2020, the house price index for Fort Lauderdale was at 320.24 and is now at 504.90 per the Fed. Which brings us back to Kristin’s incredible post and research highlighting a property in a nearby neighborhood scooped up by an investor who is now likely in default as their balloon mortgage comes due.
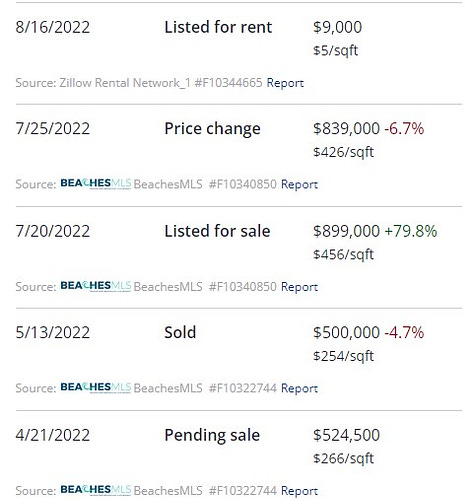
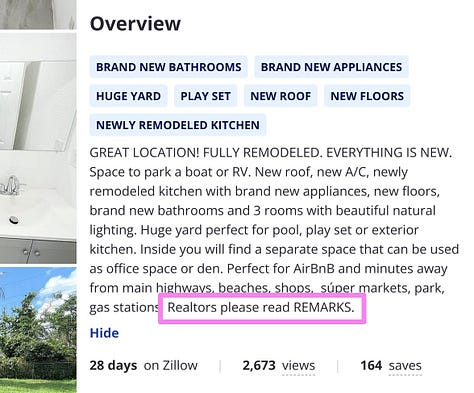
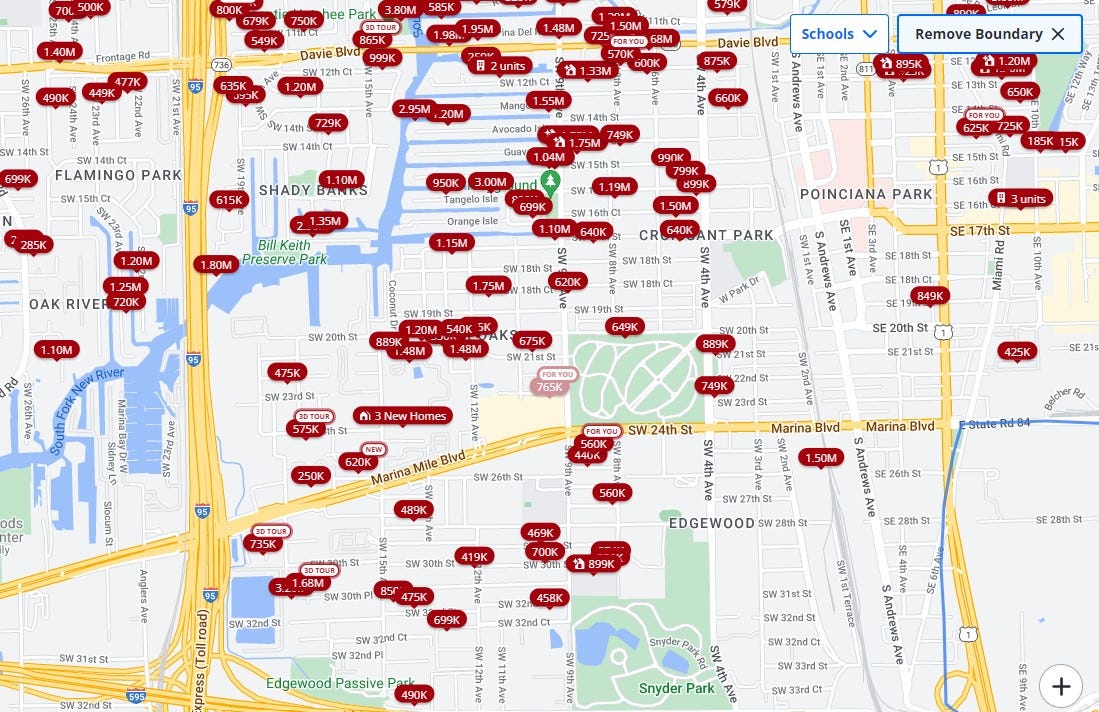
Take a look at the amount on that original note of $532,488 originated in 2022 where the sold price was $500K (below). That in and of itself is a bit suspicious. As mentioned in this Philly Fed paper and based on what I’m seeing live in client books, fraud has persisted in full force since the GFC, and the Fed estimates that almost a third of investor purchases are fraud. The entity on this note is not an originator I can find or know. It could be whoever originated the loan used a service like AirDNA as discussed last week and the investment company on the note underwrote the property on projected income. In the description, you can see they are pushing the Airbnb angle. Listed for rent at $9K a month in August, this property now is listed for sale with a current asking price on Realtor.com of $765,000. Median income in the area is $66,994. If you make this home yours, you will be 7 short miles from the beach.

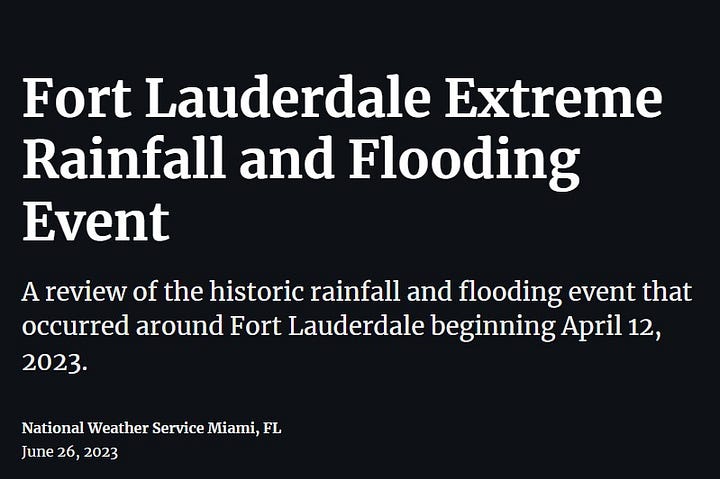
But that long walk to the beach is not your only concern as there is an awful lot of construction and mold removal going on in the neighborhood due to historic flooding in 2022.

Wonder what the insurance is like in this spot? As we drove through this neighborhood I was reminded of a neighborhood adjacent to downtown Austin, rife with investor activity. In that neighborhood in Austin, there were all sorts of new-builds in odd shapes and painted black (?), homes being torn down, homes being renovated, homes vacant. What I didn’t see was a lot of residents. Similarly this property in Broward county was surrounded by similar construction sites with only a few hapless residents, some living in their adjacent camper as repairs were completed.
For the above property, there was an assignment recorded at the county recently (meant to show transfer of beneficial ownership) which tells me it is likely in default as that is one of the first steps in a default process…or some “transfer” of ownership is occurring pointing to more fraud. I cannot say for sure, but this is one of many properties listed in this area.
Inventory shortage? Not in this neighborhood. These homes are relatively small and built in the 1950’s, originally catering to families. What do the asking prices tell you above? And what does it tell you about our housing market?
Many believe those Zestimates on Zillow (largest stakeholders of Zillow are BlackRock and Vanguard) which are usually much higher than any other listing site and believe they will be able to sell their properties at such elevated prices largely because of the inventory shortage narratives that prevail in our media. Housing has become a casino.
And, for a moment, let’s say for kicks and giggles that the people selling these homes above are the actual residents and not investors who came in after the flood to snap these up. Who will be able to afford these prices?
The median price of a new home in February 2020 was $331,800; this peaked at $496,800 in October 2022, a cool 49.7% rise. While that median price has since slid to $436,700, it’s laughable to draw comparisons to the increase in median incomes. The latest data we have on hand is that median household income rose from $68,703 in 2019 to $70,181 in 2022, a pickup of 2.2%
A Rose by No Other Name, Danielle DiMartino Booth
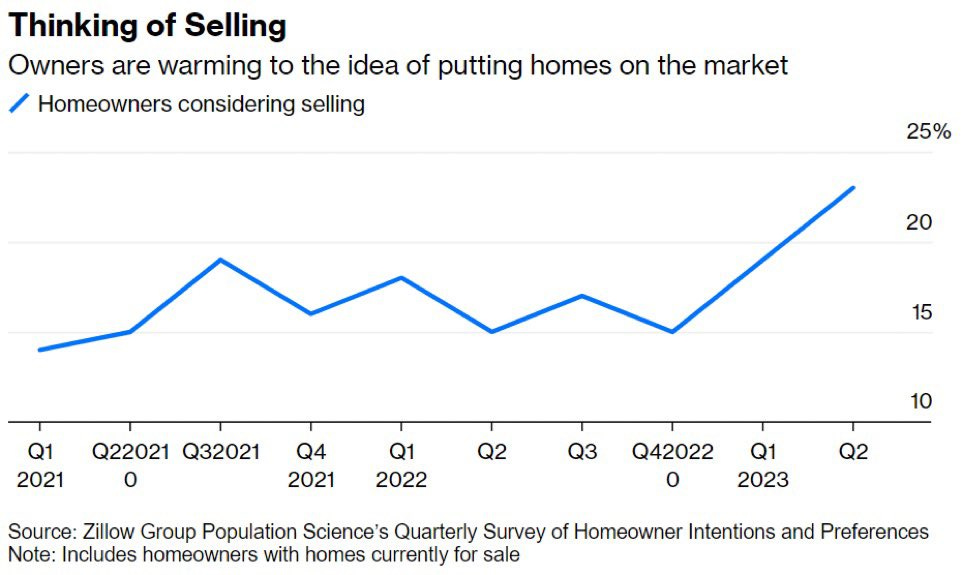
Although the media wants to focus on rates, affordability for most Americans exited stage left somewhere in late 2020, early 2021 due to skyrocketing home prices. And those that purchased anyway are experiencing severe buyer’s remorse as they receive their first property tax bills in the mail, followed shortly by the news of an increase in insurance premiums. As you can see from the graph below the people who are considering putting their house on the market has increased significantly since Q4 2022.
This story is complicated and there is not one driver. Nor was there one driver in the last housing crisis despite what mainstream media says. As mentioned in previous posts there are many Fed papers that paint the whole picture. The majority of subprime was really alternative products like the Debt Service Coverage Ratio (DSCR) loans we have today - just like the balloon note above - made by irresponsible lenders. But, this is just one piece of the puzzle. The rampant building of short-term rental, Built-for-Rent, multifamily and yes, single-family homes without the demographics to support it are the recipe for our upcoming disaster.
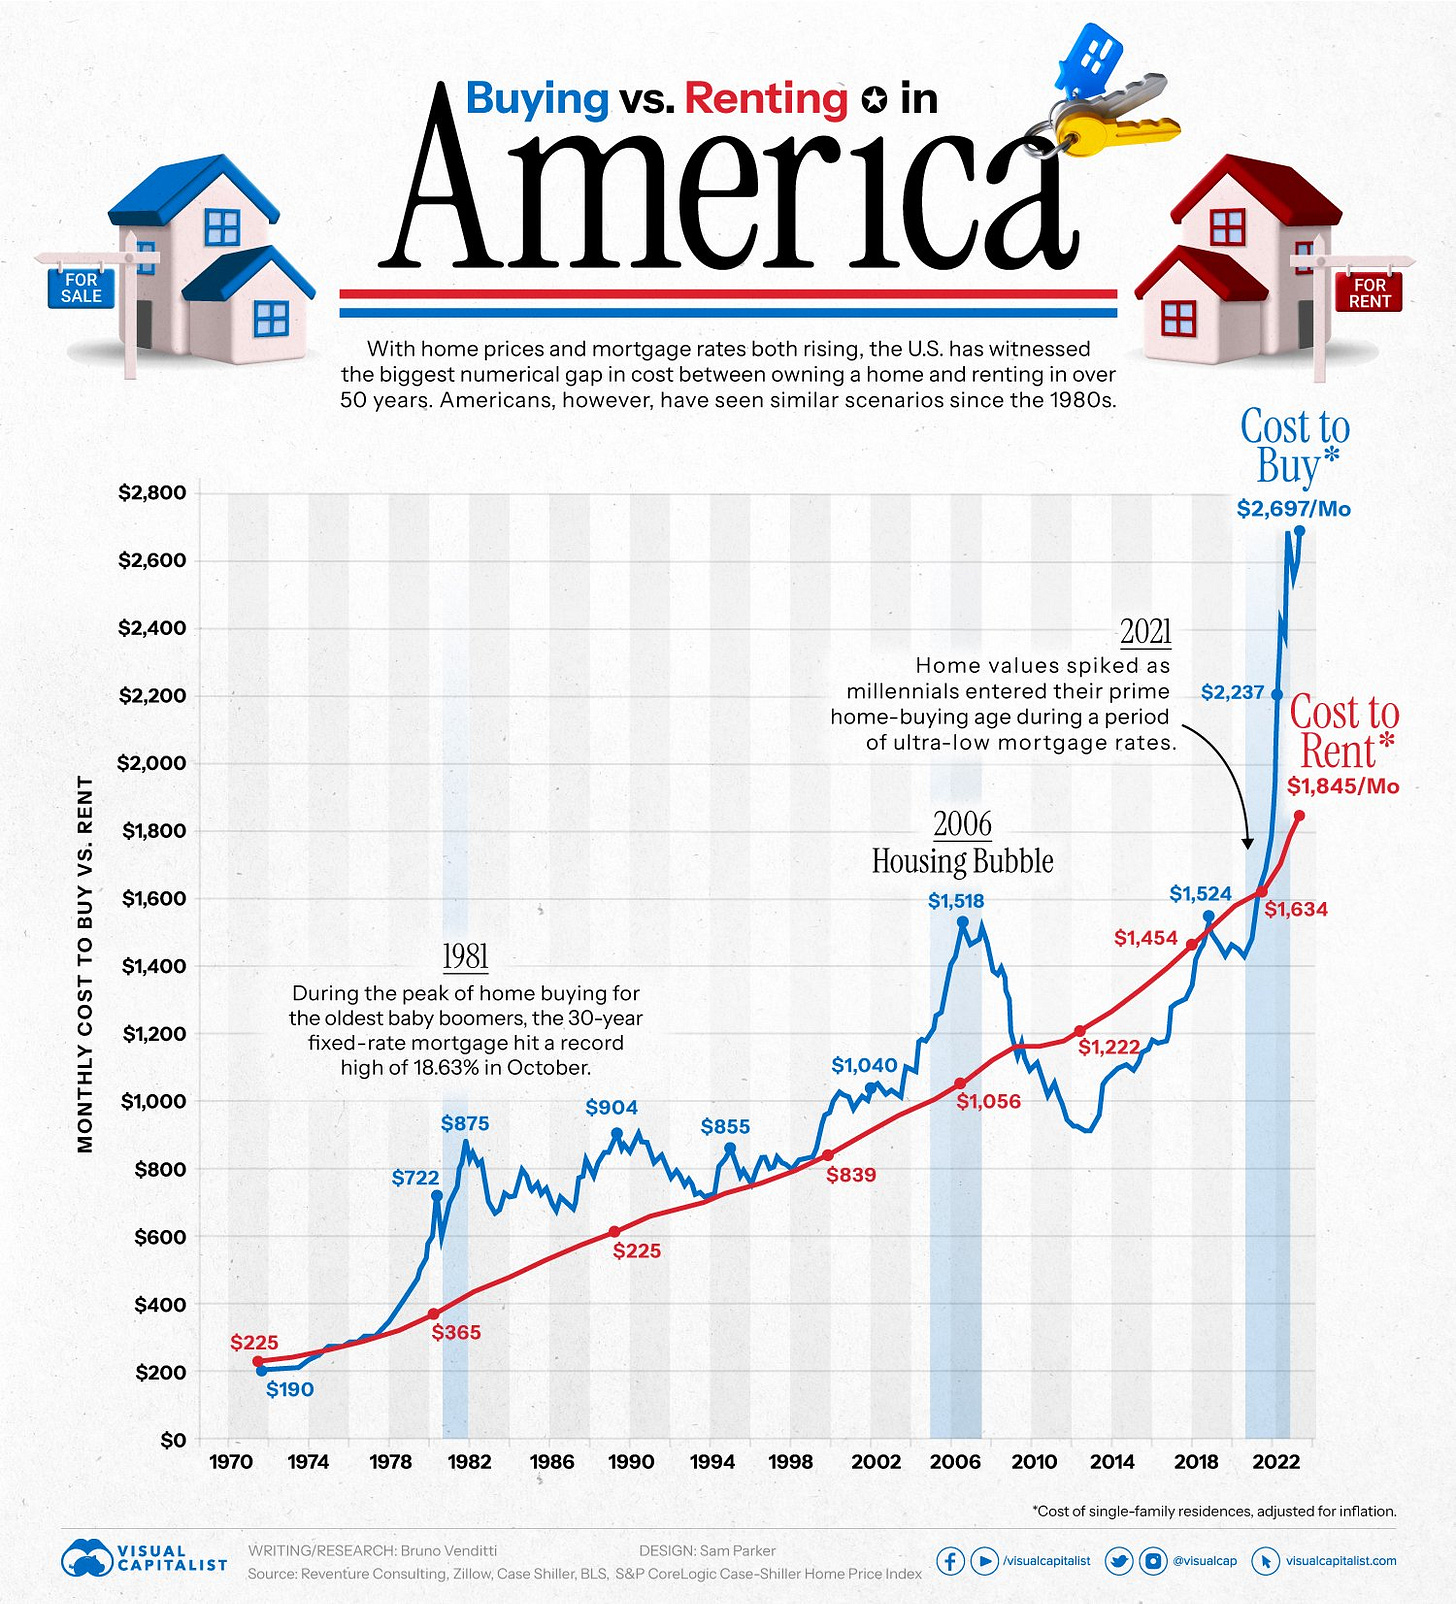
Contrary to what most have been told their whole lives, it is now cheaper to rent in most cities. So what happens until prices and rates enter the ranges of affordability again and new rental inventory comes online?
And, that’s the short-term rub. What about our demographics? If you were unable to join, please take a listen to this great conversation on our demographic picture with @economica:
And there is much, much more inventory coming online. If you read my post from a couple of weeks ago, you know that we do not have the full picture based on our listing sites which cannot and will not reflect all the data. And, in case you are wondering, the Fed uses Realtor.com for its inventory numbers.
The consumer is cracking as delinquencies on credit cards, autos and yes, even mortgages start to climb. Per a recent Bloomberg article, “among households using the Supplemental Nutrition Assistance Program’s boosted pandemic benefits, 42% skipped meals in August and 55% ate less because they couldn’t afford food.” And, as I argued on Twitter, it is not just the less fortunate who are struggling. I am seeing distress in the investor class, or so-called superprime and credit-worthy (for now) smaller investors.
We are in early innings, but soon we will see those investors who came in hot (similar to the tipsy boaters), tuck tail and run. It’s happened before and it will happen again.
Listings for Sale
Listings are down 1.59% in the cities I track this week, and I have started to notice a pattern that listings dip at the end of the month. This is borne out when looking in detail at listings where people pull them off the market at the end of the month so they don’t show aging over 30 days. So, will be interesting to see next week’s numbers.
Top Cities with Largest % Increase in Inventory Week-over-Week (8/27-9/3)
Rosemary Beach 9.68%
Cape May 5.88%
Westchester County 2.49%
Salt Lake City 2.37%
Galveston 1.85%
Top Cities with Largest % Increase in Inventory Compared to 10-week Average
Rosemary Beach 30.77% (#1 for 2 weeks in a row)
Bozeman 7.75%
San Ramon 7.22% (down from #2)
Westchester County 6.73%
Augusta 6.51%
Top Cities with Largest % Increase in Inventory from Start (1/1/23)
San Ramon 118.33%
Coeur d’Alene 85.49%
Denver 55.04% (up from #4)
Rosemary Beach 54.55% (up from #9)
San Francisco 51.72% (down from #3)
Austin 48.46% (down from #5)
Galveston 46.34%
San Jose 44.72% (down from #6)
Bozeman 40.22% (up from #10)
Portland 36.87% (down from #8)
Top Cities with Highest % Increase of Single-Family Rental Listings (8/27-9/3)
Listings for rent (unlike listings for sale) went up approximately 1% week-over-week
Charlotte 55.53% (this looks like a data issue, but still up 13.53% to average)
Winter Garden 17.53%
Brattleboro 17.39%
Portsmouth 14.29%
El Cajon 11.35%
Top Cities with Highest % Increase of Single-Family Rental Listings to 10-week Average
Encinitas 38.67% (up from #2)
Galveston 26.54% (up from # 5)
Rosemary Beach 24.35% (down from #1, but listings for sale up)
Augusta 21.42%
Portsmouth 20.00%
Top Cities with Highest % Decrease of Single-Family Rental Listings (8/27-9/3)
All but Scottsdale saw increases in listings for sale this week.
Rosemary Beach -13.33%
Destin -11.29%
Sedona -9.72%
Scottsdale -9.45%
Bozeman -9.09%
Airbnb/VRBO - Short-Term Rental
On average, short-term rental listings in the cities I track increased by 1.28% from June to July and 6.02% since January. These moves are consistent with what I’ve been hearing anecdotally on social media…there are still FOMO’ers jumping in, but the rate of that change is slowing from last year. From January to July of 2022, short-term rentals in these cities increased by 23.14%.
And, in looking back to 2020, STR listings have increased 42% since December of 2020.
Top Cities with Highest % Decrease in Average Daily Rate (ADR) Week-over-Week
Rosemary Beach -38.39%
El Cajon -34.32%
Destin - 32.42%
Encinitas -31.69%
San Diego -28.82%
Top Cities with Highest % Decrease in Average Daily Rate Compared to 12-Week Average
Rosemary Beach -45.55%
Ventura -31.99%
Indianapolis -24.65%
Destin -19.32%
Hoboken -18.95%
Top Cities with Highest % Increase in Average Daily Rate Compared to 12-Week Average
San Francisco 53.82%
Johnson City 33.10%
Austin 16.84%
Oceanside 16.53%
Las Vegas 14.37%
Top Cities with Highest Average Daily Rate - July 2023 (should have August next week)
Newport Beach $771.53
Westchester $744.91
Rosemary Beach $720.82
Cape May $592.29
Encinitas $576.17
Top Cities with Highest Average Daily Rate - July 2022
Rosemary Beach $799.85
Newport Beach $767.51
Westchester $619.46
Cape May $579.92
Encinitas $570.53
Commercial Real Estate (CRE)
For an incredible post on Commercial Real Estate this week, would encourage you to check out Rudy’s post from last week. Lots of goodies including this chart:
I would argue we got a whole lot of empty buildings (among other useless things) for $30T in debt…our bridges to nowhere.
As I travel from city-to-city I wonder why-oh-why we did not spend that money on much-needed infrastructure. Sigh.
Keeping this chart in for fun!
Very much looking forward to the John Toohig interview with Jack Farley which should go live this week.
In the meantime, here is a choice graph for reflection:
Reference articles:
Return-to-Office Is a $1.3 Trillion Problem Few Have Figured Out (yahoo.com)
Asset managers look to sell Hong Kong buildings as higher rates bite | Reuters
CIBC to focus less on US office real estate after profit miss | Reuters
Industrial Absorption Drops 67.3 Percent from Last Year (trepp.com)
Cannae Advisors, Morgan Stanley Buy $174M Debt Attached to Albany Mall – Commercial Observer
EY: Five Takeaways from a Recent Look at Office Trades - Connect CRE
Blackstone Selling 22% Stake in Bellagio to Cash In on Las Vegas Rebound - WSJ
Landlords With $1.2 Trillion of Debt Face Rising Default Risks - Bloomberg
Office Tenants Are Renewing Leases—but for Far Less Space - WSJ
Plunder: Private Equity's Plan to Pillage America: Ballou, Brendan
More articles linked below in the reference section below….
Coming Soon: Whatever I can manage :). It’s been a crazy summer, and I still have to make a living, so I will do my best over the next several weeks as I try to do more local Florida research and keep my finger on the pulse of macro.
Reference
Rent
As mentioned here previously I have been struck by how little movement there has been using RealPages, but this month I noticed something interesting. RealPages started including some statistics in its write-up of each city including year-over-year changes in occupancy for all but a few key cities which is telling in and of itself. In case you haven’t seen this, RealPages is currently under investigation by the DOJ.
Average year-over-year decreases in occupancy for the cities I track and the cities that RealPages lists is -1.57%. Some of the key cities that are missing these stats in their write-ups: Chicago, Dallas, Houston, Nashville and Phoenix. Someone has shared a new source with me that I will be looking at next week as well.
Top Cities with Highest % Decrease in Average Rent June to July
Nashville -15.92%
Asheville -13.71%
Coeur d’Alene -11.88%
Destin -10.28%
Chicago -9.68%
Top Cities with Largest Decrease in Occupancy Year-Over-Year
Augusta -3.09%
Tucson -2.44%
Boise -2.30%
Atlanta -2.30%
Indianapolis -2.18%
Notable Mention: Miami - 1.91%
Airbnb/VRBO - Short-Term Rental (STR)
Top Cities for Short-Term Listings July
New York 26,809
Miami 14,502
Las Vegas 13,913
Los Angeles 11,765
Houston 11,588
Austin 10,911
Atlanta 10,879
San Diego 10,746
Orlando 9,763
Sevierville 8,816 (knocking out Nashville from June)
Top Cities with Biggest Increase in Short-Term Rental Listings Jun-July
Fort Myers 14.35%
Indianapolis 6.53%
Las Vegas 6.43%
San Diego 6.24%
Oceanside 5.32%
Top Cities with Biggest Decrease in Short-Term Rental Listings Jun-July
San Jose -6.37%
Phoenix -5.25%
Portsmouth -4.85%
San Ramon -4.30%
Tucson -4.16%
Top Cities with Biggest Increase in Short-Term Rental Listings Jan-July
Destin 37.32%
Coeur d’Alene 36.71%
Cape May 31.94%
San Ramon 28.99%
Palm Springs 22.49%
Top Cities with Biggest Decrease in Short-Term Rental Listings Jan-July
San Jose -21.04%
Dallas -18.02%
New York -13.39%
Fort Myers -11.82%
Houston -8.53%
Top Cities for Short-Term Listings July
New York 26,809
Miami 14,502
Las Vegas 13,913
Los Angeles 11,765
Houston 11,588
Austin 10,911
Atlanta 10,879
San Diego 10,746
Orlando 9,763
Sevierville 8,816 (knocking out Nashville from June)
From Inside Airbnb
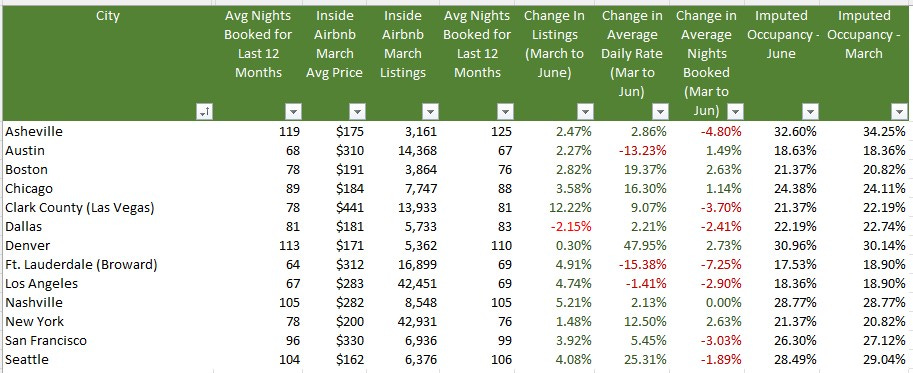
As I’ve mentioned previously all data is not equal. Inside Airbnb has incredible data, but it is only for a handful of cities and is published once a quarter. Their listings tend to be much higher than the data provided by AirDNA and others, but they trend in the same direction. In October I will do a deep-dive on the differences and trending so we can see how closely the myriad data sources track. But, for example, Inside Airbnb data shows Nashville with 8,993 listings at the end of June while AirDNA has 8,105.
Only one city in the cities they track- Dallas - showed a decrease in listings from March to June which was likely due to the recent legislation. As the stock market took off so did everyone’s hopes and dreams. Unfortunately, I believe that not only will legislative efforts start to tick up (Airbnb’s lawsuit against NYC was dismissed last week), but the sentiment will likely sour in the next months based on macroeconomic clouds that are gathering.
Historical & Monthly Comparisons
Lowest Occupancy July 2023
Augusta 55.33%
Winter Garden 51.40%
Palm Springs 52.02%
Phoenix 54.68%
Sedona 54.60%
Lowest Occupancy July 2022
Palm Springs 50.45%
Sedona 50.93%
Tucson 52.00%
Phoenix 53.78%
Augusta 55.33%
Highest Occupancy July 2023
Destin 91.44%
Newport Beach 91.21%
Cape May 90.50%
Rosemary Beach 88.91%
Oceanside 88.87%
Highest Occupancy July 2022
Cape May 93.39%
Rosemary Beach 89.34%
Destin 88.97%
Westchester 87.17%
Oceanside 87.17%
Commercial Real Estate
Going to keep this incredible podcast with Jack Farley, John Toohig and Randy Woodward in this section until they do the next one - it’s just that good.
Per John, the only commercial real estate trading at the moment is for Trash and Trophies and despite MSM narratives trouble is on the horizon. Miss this at your own risk.
Additional Articles
Loop landlord files for bankruptcy ahead of foreclosure sale | Crain's Chicago Business
Google Looks To Offload Another Big Office Campus in Silicon Valley (costar.com)
WeWork Risk Seen in Commercial Mortgage Bonds, Barclays Says (yahoo.com)
Big Banks Are Trying to Dump Commercial Real Estate Debt As Pressure Mounts (businessinsider.com)
The Commercial Real Estate-Small Bank Nexus | ZeroHedge
Local Malls, Stuck in ‘Death Spiral,’ Plunge in Value - WSJ
Troubles for Wall Street office tower worsen as foreclosure looms (nypost.com)
Understanding the challenges in the U.S. commercial property market
Commercial Property Investors Huge Office Bet is Unraveling In London, New York and Paris
Commercial Real Estate Reset is Causing Distress from Sand Francisco to Hong Kong
CRE’s Strains are contained: But in a recession the dam won’t hold. (contained you say?)
Big commercial real estate downturn could sink 300+ banks: Report | American Banker
Westfield Gives Up Downtown San Francisco Mall (sfstandard.com)
Goldman Sachs CEO Solomon warns of commercial real estate write-downs (cnbc.com)
Hotel Owners Start to Write Off San Francisco as Business Nosedives - WSJ
Sunbelt Construction Boom Threatens Top Apartment-Building Owners - WSJ
US banks prepare for losses in rush for commercial property exit | Financial Times (ft.com)
Interest-Only Loans Helped Commercial Property Boom. Now They’re Coming Due. - WSJ







1st! LOL. Great read. Inventory has ticked up a bit in Wexford County. More interesting to me is that I put in the 5 months we will be off the boat. Over 100 STRs came up with all 5 months still open. VRBO says that reps 28% of available properties. Likely suspect data. But, to the extent it is even marginally reliable, having 28% of available properties without a single date booked during a 5 month period doesn’t seem good. And the quoted prices for a large % of them are just laughable. One has to wonder, come spring, what % of those are up for sale after a very dark winter. And what % will it take to reset the entire county.
Great read. I live in San Diego. In 2017 we were battling for a SFR in Poway, CA and I put a bid in on house. We could not take a tour..just had to bid. There were 24 offers and 16 all cash... can you say speculation. It's crazy how the Media barely reports on how the investor classes have pushed prices into bubbles. They often say there's not the speculation/house flipping like there was in '06 - '08 so there's no bubble. You'll hear the local realtors claim that there's not enough supply and this type of investor demand is part of normal functioning housing market. On the west coast I reckon there were three types of investors and these are in order from the earliest to the most recent. 1. institutional investors like Blackstone 2. Foreign Investors. Berkshire Hathaway was marketing West Coast properties in China. 3. AirBnB investors. The most tired thing you'll hear from realtors is that the Real Estate Market is local. They often forget that the money and financing is not local, but it is out of state and international.