We have been talking about it all year, but surviving the information waves crashing down upon us is becoming a Herculean task. With all that has transpired in the last several weeks, sanity must be sought and found. Assassination attempt, dropped presidential bid and a “rumored” missing President aside, we have had two huge developments in the housing market that will inform our path from here.
Before we start discussing those, however, a little dose of sanity from the garden.
Homegrown tomatoes home grown tomatoes
Wha'd life be without homegrown tomatoes
Only two things money can't buy
That's true love and homegrown tomatoes
John Denver, “Home Grown Tomatoes”
Although I am more a fan of the Guy Clark version, I tend to agree that home-grown tomatoes are among life’s true treasures. Yesterday, for the first time since I was a child, I had the pleasure of eating one from my own garden. Unbelievably divine. And, even more divine that I didn’t have to pay someone else for that pleasure. Eating and cooking food you have grown is a truly gratifying feeling - one we’ve lost as we became more and more separated from the growing and preparation of our food.
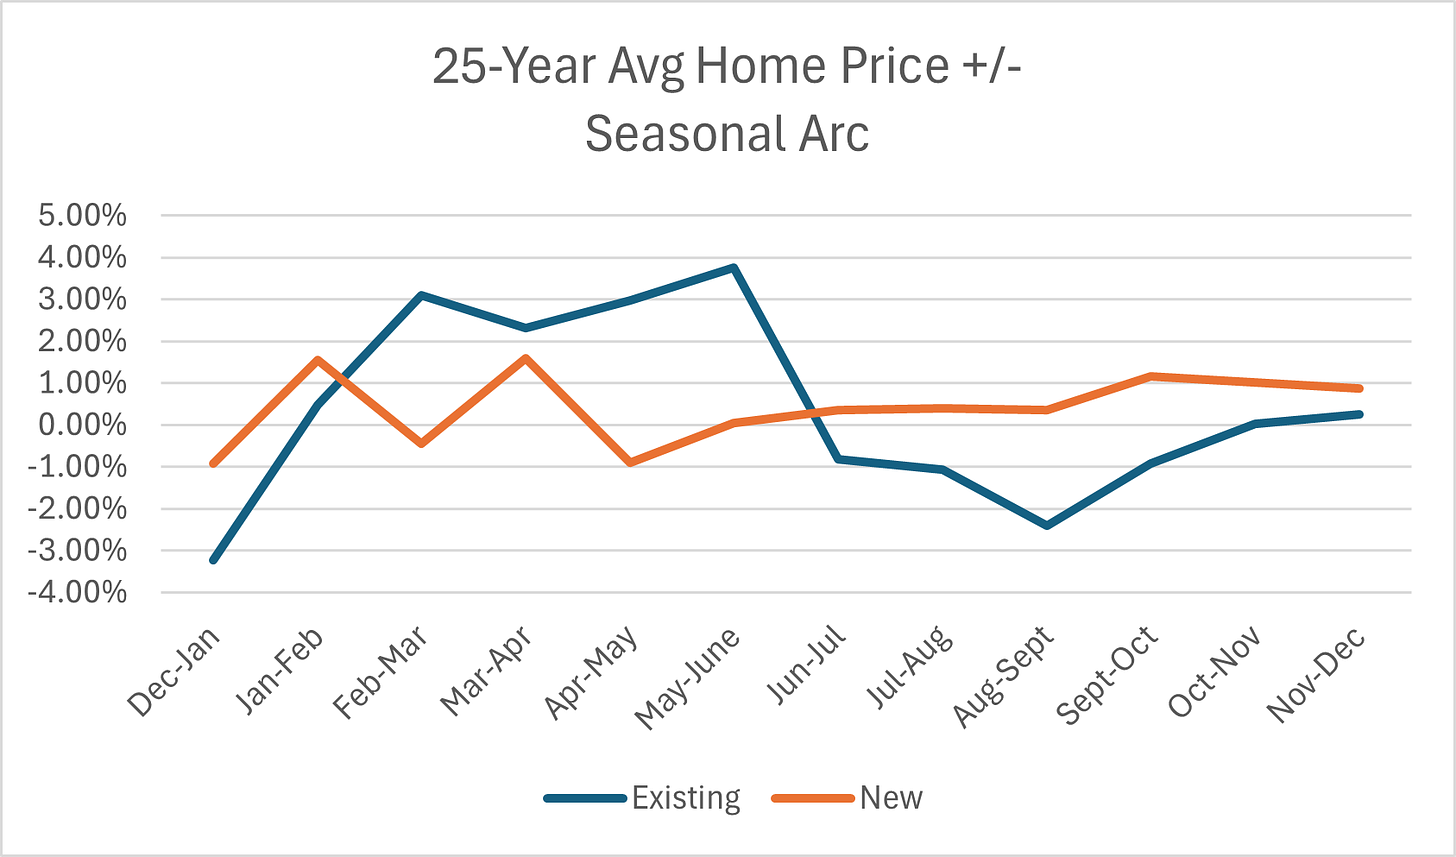
The small pleasures and joys must be savored as they are increasingly getting pummeled by the raging bots in this season of our discontent. After receiving the 25-year history from a subscriber for Existing Home Sales earlier this year (forever grateful), I found a calm that many did not have because I could see how powerful the seasonal arcs were no matter the macroeconomic environment. I could also see how the likes of Larry Yun and Mark Zandi led my former company astray during the depths of the crisis. Each month during the seasons in 2007, 2008, 2009, 2010, 2011 for instance our executives bought the tales that Yun and Zandi spun that things were turning around.
They followed these analysts all the way to our bankruptcy filing in 2012. But, sell-side analysts will never see things through the prism most beneficial to the consumer or the industry they supposedly inform.
Could we veer from the arc? Absolutely. In fact, I have a feeling we are about to see some interesting departures from the norm. I was initially estimating 441,000 for combined sales (both existing and new) for June, which would be lower in June than any other year in the last 25 years of tracking and lower than June of 2008 at 466,000. I was 6K off for existing, so I am now estimating 435,000. We will know tomorrow if the builders went all out to grab market share from existing yet again. If not, we will be looking at combined June sales lower than 2008. I will publish a brief update tomorrow once we receive that data.
For existing home prices, though, we stayed right on track for June. Today we received data for existing home sales, and the median existing home price reached another all-time-high (ATH) this month as predicted: $426,900. Importantly though last month was revised down slightly from $419, 300 to $417,200. A small dip you say, but important because the revised median home price is now lower than the initial new home price for May - $417,400. Or in other words, this revision restored the historic relationship of new homes prices being higher than existing prices. It is likely we will get a revised median new home price for May tomorrow, but the historic flip last month in the initial numbers has only been seen twice before in the last 25 years - June 2005 and June 2021.
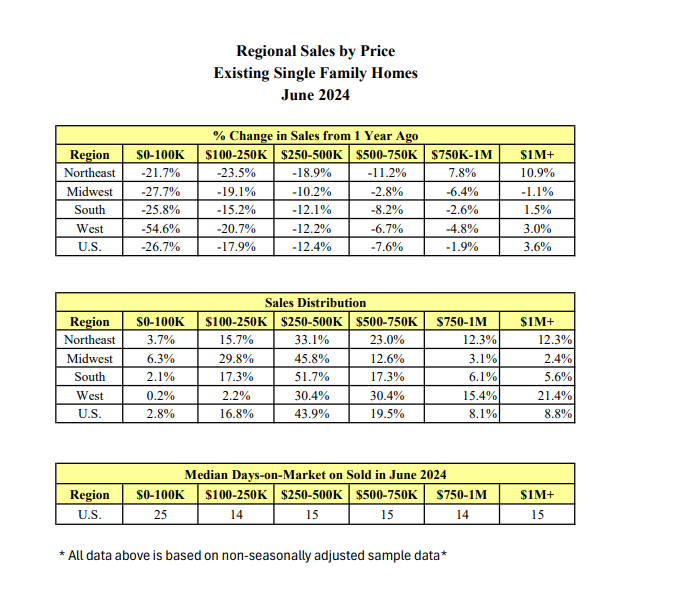
As to the sales, however - abysmal. Using non-seasonally adjusted numbers, existing home sales were down -13.4% YOY and -7.4% MOM. For perspective the 25-year average is an increase from May to June of 8.69%. Ouch. So, why the increase in home prices when inventory is rising and sales are down? The only category to see an increase in YOY sales is the +$1M category. And the category with the smallest YOY decline in sales is the $750-1M category.
Feeling depressed? Fear not as this slowdown in sales shows that indeed the cure for high prices is high prices. As the builders push to move product and we exit the season, we will start to see existing home prices come down.
In addition to these shocking sales results, we also saw the highest increases in MOM delinquency in the Black Knight series for June since April of 2020 - a whopping 19% increase for 30+ delinquency. In this week’s post, we will discuss what this increase in delinquency means for the path ahead as well as some new programs or policy changes recently announced from the FHFA and CFPB which are meant to address rising delinquency. I will also be sharing the M3 city trends from Redfin on sales and prices as well as listings of cities where markets are frozen, hot or on-the-move. There were only 11 cities where YOY sales were up out of the 82 I track….in the high season.
It seems as if indeed, no matter what NVIDIA is doing (especially when you look at MOM CA declines), the consumer has had enough.
Danielle DiMartino Booth, The Daily Feather
Let’s dive in.
Keep reading with a 7-day free trial
Subscribe to M3_Melody Substack to keep reading this post and get 7 days of free access to the full post archives.


