


As I plopped down at the bar at a local Applebee’s in Wytheville, VA, I had my armor and phone turned on, hoping for a quick meal after a day of wrapping up my four-year deployment in Pittsburgh which included packing, cleaning, stressing, driving. Looking down, I surveyed the bar peripherally to Bourne-style assess the situation. Relieved, I realized that I was surrounded on both sides by mostly elderly men who were winding down after a day of labor, nonchalantly watching a baseball game. With ambient country playing in the background, my danger meter dialed down significantly, and I took a deep breath.
In these cases, a good ol’ cheeseburger is my go-to having realized over the years it is your safest bet on the road with limited dining choices. I’ve found chicken and fish for whatever reason seem to be more susceptible to variability and yuckiness in chain restaurants. So, having ordered, I relaxed a bit and started looking at my phone. As I had been away all day, I just didn’t have it in me to turn on Social Media Barbie. So, I put it down and started pseudo-watching the game. And, then it happened.
I may have mentioned after the GFC and managing the default crisis, I sort of retreated, licking my wounds, as I hadn’t found Rudy on Twitter yet, and everyone around me was acting like the GFC didn’t matter anymore. To me, it did still matter and I could see people continue to struggle despite what the newspapers said. I was anti-social media at the time, but if I had been a little more open, I would have found my crew a bit earlier. However, I honestly believe I had to hide and take time to put it all into perspective. Retreating though meant that I missed a lot of pop culture at the time, and I guess I unknowingly missed a phenomenon.
That Tuesday night in Applebee’s it started as a bit of under-the-breath humming, but not from one individual….it was coming from all around me, including the servers. And, even though country is not typically my jam, I couldn’t help but to also start nodding to the melody. At the chorus, the entire bar erupted and sang along and continued to sing for the duration of the song. For a moment, I wondered if I was back in Ireland, lucky enough to be invited to a local lock-in. Appalachia is of course filled with the Scottish and Irish, my kin, so a fitting comparison. But, I found myself smack dab in the middle of synchrony. If you don’t know, that’s what it’s called when people spontaneously and simultaneously participate in an activity together. As humans it is a must for our well-being. Think sporting events, church services, Applebee’s singalongs - it is how we as humans feel like we are part of something greater, outside of our limited perspectives and all-consuming narratives of self.
Toby Keith’s I Love This Bar was released in 2014 right before we all went bat-sh*t crazy. And, if you haven’t heard it, I recommend you listen all the way through it because it’s about inclusion in places where you wouldn’t expect it. It’s about being able to hang at the local watering spot with people who are not like you and enjoy those differences. And, that’s exactly how I felt sitting in Wytheville, VA - included. No one was talking about politics or social construct issues….no one was shouting….everyone was just being together in their favorite bar after a hard day of work, and they were welcoming. After the song ended I felt comfortable enough to let my guard down and had a wonderful time chatting with everyone.
What does this have to do with housing and the economy….well, folks, it’s time we put down the phones and our media feeds and do some figuring and experiencing for ourselves. After this two-week hiatus into the real-world I can tell you for sure that the stories we are reading just ain’t so. Now, it’s one thing if you want to be in the dark, but if you count yourself as in the know, I suggest a little trip outside your comfort zone. Then and only then will you see the scale of what is happening around you. Or, take a little trip down memory lane to read some of the press about the optimism during 2007. Rudy’s Substack and Eurodollar University are both fantastic sources for that discussion. Being in the soup means that you cannot tell which way is up or down, but this blog and others are here to give you a helping hand out of the bowl.
So, a little anecdata - I spent the first week of my break in Hilton Head on a trip that the Alabama clan has done for at least ten years. The one time I had previously made an appearance many years ago I remember being sweaty and miserable in crowds and lines at such hotspots as the Salty Dog Cafe. And, although this time there were a couple of experiences with long waits, it wasn’t due to unbelievable crowds or throngs of people, rather labor shortages. Think back to pre-COVID times when you saw your server 60 seconds after being seated….and in some places, they might even have brought water to the table upon first greeting. Now ponder your current experiences as you get a crick in your neck looking for your server. The sheer inefficiency I see in restaurants these days is an affront to this former server. Turning tables used to be the name of the game. Now, they make you wait 15 minutes between seatings to let the kitchen catch up. So, a restaurant can look crowded with people sitting there waiting for their food, waiting for their drinks, waiting for their check. But, in reality it is nowhere near as busy as it used to be. The one night we did a family dinner in a more up-scalish area, we were the only table in the place. And, breakfast at Salty Dog Cafe? Didn’t have to wait in line for an hour like last time - we were one of four tables. Don’t get me wrong, Hilton Head was still busy (especially the grocery store), but most of the people I met were the ones who come every year for the 4th of July week and nothing short of a natural disaster would keep them away. But, it was muted.
And follow this example through….you may think it will all net out - less labor, less expense, right? That’s not how it works. There are several studies about the cost of turnover and although of course pricier in certain industries, it is costly to replace and train workers over and over because you lose efficiency. Efficiency and the margin you gain from it is achieved through routine. When there is no routine due to labor disruptions you soon find yourself in an incredibly frustrating doom loop. Demand may exist, but you cannot meet it in a way that ensures your profitability. You ultimately get a little behind, then more behind and then a lot behind. And, then you shut your doors. Bankruptcies are historically low, but they are starting to tick up at an accelerated pace.

Check out that increase in small business filings. This overall increase is not only being driven by folks under stress, but also by strategic defaulters who know exactly how to play this game, including the Private Equity (PE) pirates discussed in Plunder by Brendan Ballou, special counsel at the DOJ. This is an enlightening book highlighting how PE has been responsible for massive changes in the way we live, get doctored and work. I recommend this book to EVERYONE.
But back to the topic at hand - so goes the economy, so goes housing - and many say so goes housing and so goes the economy. No matter which way you slice it the consumer is coming under significant stress. Right as I was leaving on this two-week odyssey, I wrote about what I was seeing in FHA portfolios with the death-cross from 30 to 60 days delinquent. Black Knight talked about historically low default in their May report, but buried in a footnote they admitted to what I saw as well. While GSE delinquency is still low, FHA and VA delinquency are above pre-pandemic levels.
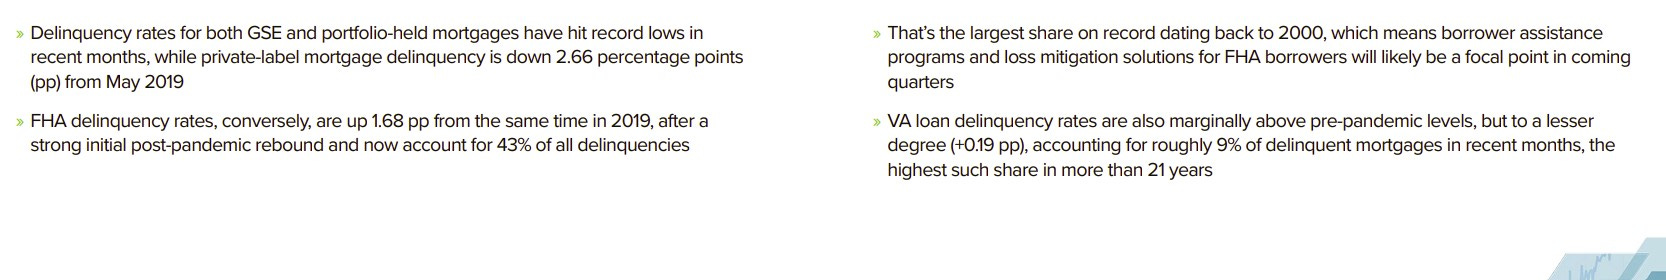
The prime GSE borrowers are currently hiding the consumer stress, but in my delinquency reviews of June data guess who did their own little death-cross? Yep, it’s starting. Now, again, we will not suddenly have a million foreclosures. We have to understand how all this works especially for GSE and FHA/VA-backed loans, so please check out my YouTube deep dive on this topic. Nonetheless, the increases in property taxes, home insurance, car insurance and credit card rates mean your consumers are struggling.

*Sourced from Danielle DiMartino Booth’s recent Substack.
Many Americans, including people in my family, use their credit cards for basic necessities. They try to pay off the balance each month, but it is increasingly hard to do so. Those “tiny” credit crunches matter when it comes to paying the big bills, and it is starting to show. Due to all the credit quality gospel singing, 99% of the people in my industry think this is no big deal. This is because they have just been listening to the same hype you have without really looking under the hood. Industry participants rely on the automated underwriting systems (AUS) provided by the GSEs. If it’s good there, then surely it is good. But, as credit scores have been inflated due to all of the stimulus and forbearance programs and moratoriums, how reliable are these models and their assumptions? Based on what I’m seeing by looking at the loan details, many in the industry are about to get burned. What they don’t understand as they missed the last cycle is that the GSEs have hardly any risk. If a loan goes into default, they just hire a junior associate to find something wrong with the file. In this industry finding an issue is very easy to do as the systems are so old and antiquated with zero field-security meaning any user can change critical data in the system. If an issue is found the GSEs will make you repurchase it. And if you are an aggregator, you will turn to the entity that packaged that loan for you and ask them to repurchase it. And guess what, if it is a FHA/VA (GNMA) loan you have to buy it out of the securitization pool to do a modification which means significant liquidity utilization. And, often when you have to re-securitize it you have to take a hit on the price. I recommend everyone listen to the deep dive I did on the Dark Side of the Boom and contemplate that some of your biggest players weren’t playing big last time and are in for a nasty, nasty surprise. Many are already complaining and it hasn’t even really started yet.
Leaving you high-and-dry the last couple of weeks was a bit hard, but it opened my eyes even more to the ridiculousness that is FinTwit and our financial press at the moment. When you go back and listen to the talking-heads spouting the same ol’ stuff, you lose patience as it is just so far from actual reality. Try this little exercise….think of your entire family (even the ones you don’t talk to) - how are they doing? Any members struggling? Anybody consolidating a household, moving back home with the parents, moving a parent in? Anybody not getting enough hours at work? That loser cousin still out of work? Recently one Twitter commentor told me we would not have any issues in mortgage as credit quality was so good (and to be honest I felt the same way until late last year). I said, well, it’s good now but with all these increases in taxes and insurance, we are going to see issues. He then proceeded to tell me that his daughter, a teacher, just realized after receiving her tax bill in TX that she would have to get another job as it was an extra $400 a month or sell her house. See the dissonance?
My foray into real life outside of my work-from-home bubble has armed me with sharper knives when it comes to the narratives, so get ready. Additionally, although I took a break from social media, I have been meeting with clients regularly and working on additional data sources. For the first time ever I have Airbnb listing info for all cities tracked (below). I will be heading to Florida at the end of this week to catch up with many who have participated in my Florida spaces including TrishFLSun, a local real estate expert who is a must-follow. More and more I realize that even though TX will likely be catastrophic, Florida could again be the epicenter. I spent most of 2012 there, and I have a feeling that will repeat to some degree largely due to the insurance issue.
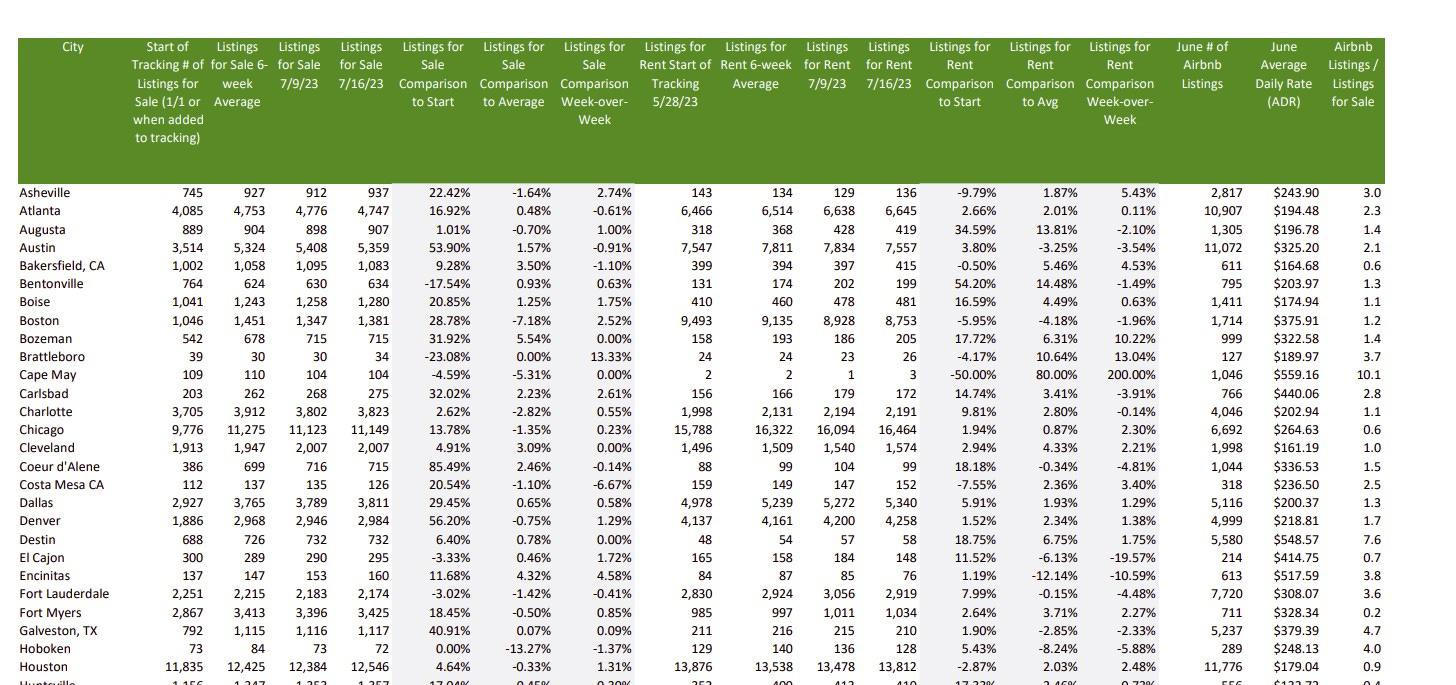
So, the next several weeks will be filled with on-the-road travel to new-build and Airbnb meccas. Reports may not exactly be on schedule, but I will do dispatches from each of the cities. I will be adding the high-level summary section later this week, but in the meantime, I am posting the master table of listings for sale and rent as well as for the first time ever, Airbnb listings and average daily rates for June (courtesy of the team at STRVerifi). I’ve also listed an interesting stat: number of Airbnbs/ listings for sale. So, for instance, in Asheville, for every one property listed for sale there are 3 listed Airbnbs. Think on that for a moment.
Full table can be found at this link:
Wish me luck as I begin my travels in search of more Anecdata, synchrony and doses of reality. I know that the more we realize our neighbors are not our enemies and adopt the small-town acceptance model, we will find our way through what’s ahead. In that vein, I hope you find some synchrony this summer as well in real life. I can tell you for sure I’m still riding high on hope from mine.
I love this bar
It's my kind of place
Just walkin' through the front door
Puts a big smile on my face
It ain't too far
Come as you are
Stats for the Week:
Listings for Sale
Listings are up on average .39% for the cities that I track week-over-week with some notable movements.
Top Cities with Largest % Increase in Inventory Week-over-Week (7/9-7/16)
Brattleboro (floods have people spooked?) 13.33% (always a very small # of listings, so small moves make a big difference)
Rochester 10.26%
Oakton, VA 7.59%
Encinitas 4.58%
Rosemary Beach 4.35%
Top Cities with Largest % Increase in Inventory Compared to 6-week Average (NEW)
Bozeman 5.54%
San Ramon 4.35%
Encinitas 4.32%
Bakersfield 3.50%
Cleveland 3.09%
Top Cities with Largest % Increase in Inventory from Start (1/1/23)
San Ramon 93.33%
Coeur d’Alene 85.49%
San Francisco 63.94%
Denver 56.20%
Austin 53.90%
Galveston 40.91% (up from #9)
Portland 40.88% (up from #8)
Seattle 37.54% (up from
San Jose 35.56%
Carlsbad 32.02% (replaces Boston from our top 10)
Rent
After re-reading this doozy of an article on RealPages, I will likely go to a once-a-month capture and focus primarily on listings for Rent. I do however think it is a data source that is important to watch. Rent price info can be found in the reference section.
Top Cities with Highest % Increase of Single-Family Rental Listings (7/9-7/16)
Sevierville 18.75% (up from #2 last post)
Brattleboro 13.04%
Bozeman 10.22%
Oceanside 9.28%
Asheville 5.43%
Top Cities with Highest % Increase of Single-Family Rental Listings to Average (NEW)
Cape May 80.00% (very small #s)
Winter Garden 22.27%
Sevierville 18.75%
Bentonville 14.48%
Augusta 13.81%
Top Cities with Highest % Decrease of Single-Family Rental Listings (7/9-7/16)
Victor, WV -25.00% (very small #s)
El Cajon -19.57%
Washington DC -11.62%
Encinitas -10.59%
San Ramon -10.20%
Rosemary Beach -10.00%
Airbnb
FINALLY! I finally, finally have listing data for the cities I track. This is so exciting. What will be even more exciting is to compare the data. There are many methodologies, and I am still diving into them all. So, where we have the data for instance for Inside Airbnb it will be interesting to see differences, but should help us triangulate the market.
Top Cities with Highest # of Airbnb Listings in June
New York 26,706
Miami 14,630
Las Vegas 13,072
Los Angeles 11,847
Houston 11,776
Austin 11,072
Atlanta 10,907
San Diego 10,115
Orlando 9,335
Nashville 8,105
Top Cities with Highest Average Daily Rate - June (NEW)
Rosemary Beach $787.02
Newport Beach $708.33
Cape May $559.16
Destin $548.57
Encinitas $517.59
Top Cities with Highest Decrease in Average Daily Rate - May to June
San Ramon -30.95%
Victor WV -15.81%
Destin -12.51%
Ventura -7.01%
Rosemary Beach -6.49%
Palm Springs -5.27%
Knoxville -5.22%
Chicago -3.50%
Nashville -2.96%
Sedona -2.87%
Commercial Real Estate (CRE)
It’s getting real out there, but what I still sort of shocking is that even very knolwedgeable have a belief that Class A will be fine. As I discussed in my Dreams of Yesteryear post, I have seen plenty of Class A that won’t make it. I think we really have to look at each market individually.
That being said it’s almost hard to keep up (know anyone who needs an internship?)
But, check out the latest from Mike, friend of the show, and Dan McNamara - a CMBS pro:
Going to keep this incredible podcast with Jack Farley, John Toohig and Randy Woodward in this section until they do the next one - it’s just that good.

Per John, the only commercial real estate trading at the moment is for Trash and Trophies and despite MSM narratives trouble is on the horizon. Miss this at your own risk.
Reference articles for this week:
Understanding the challenges in the U.S. commercial property market
Commercial Property Investors Huge Office Bet is Unraveling In London, New York and Paris
Commercial Real Estate Reset is Causing Distress from Sand Francisco to Hong Kong
CRE’s Strains are contained: But in a recession the dam won’t hold. (contained you say?)
Big commercial real estate downturn could sink 300+ banks: Report | American Banker
Westfield Gives Up Downtown San Francisco Mall (sfstandard.com)
Goldman Sachs CEO Solomon warns of commercial real estate write-downs (cnbc.com)
Hotel Owners Start to Write Off San Francisco as Business Nosedives - WSJ
And ICYMI last week:
Sunbelt Construction Boom Threatens Top Apartment-Building Owners - WSJ
US banks prepare for losses in rush for commercial property exit | Financial Times (ft.com)
Interest-Only Loans Helped Commercial Property Boom. Now They’re Coming Due. - WSJ
Coming Soon: YouTube and Twitter Summary. Summer hours and craziness continue
Reference
Airbnb
Cities on Inside Airbnb have been recently updated. Will capture those next week, so keeping the Inside Airbnb data here. Hope to do some comparisons next week as well.
MARCH
Inside Airbnb has published its data for March and in many cities there were increases month-over-month for listings after significant decreases the previous month. A good example is Austin which went from 18,337 listings in January to 13,808 listings in February and now up to 14,368 listings. Based on my travels I would say that a good chunk of people still think it’s 2021, especially the fix and flippers who may have been constrained by labor or supply chain issues and are coming late to the party. It will be very interesting to watch this trend for sentiment changes post the mid-March banking crisis and now subsequent credit crunch.
Some stats:
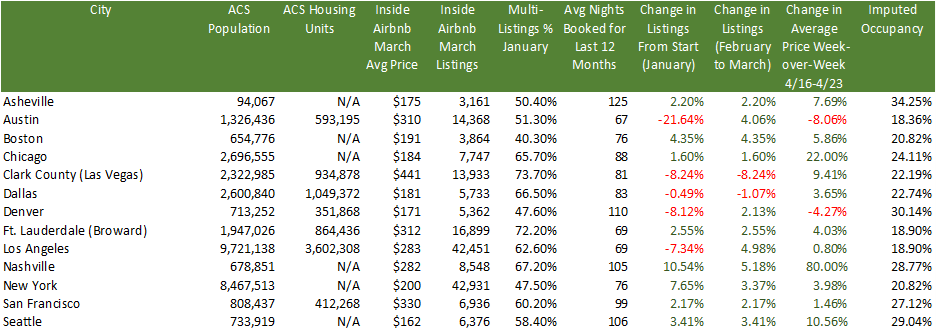
A really interesting stat above is the % of multi-listings per city. This metric represents the % of owners that list multiple properties, not just one. So, in other words, this will give you a flavor to how many investors operate in that market. The average for the cities above for multi-listings is 58.74%. So, despite what Airbnb said on that doozy of an earnings call when no one asked them about their miss in listings projections, their typical client is not someone who is trying to make just a little bit of extra cash. These are investors with multiple properties who are looking for passive income and likely bought these properties with DSCR loans or cash from loans on equity and crypto assets. And, with so many listings the imputed occupancy in these cities is very low and is likely no longer covering debt service cost.
For those who have listened to my Twitter Spaces (check out this one on Airbnb if you haven’t), you know my biggest issue with Airbnb is that besides excursions and nebulous technology improvements, adding listings is Airbnb’s only strategy for growth. I’m pretty sure there is a limit to how many hotel rooms and Airbnb listings we need in each city.
Rents
Rents are cooling from their meteoric rise and this week we see some interesting shifts:
Top Cities with Highest % Decrease in Rent (May to June)
Fort Myers -16.03%
Miami -14.84%
Carlsbad -13.45%
Oceanside -13.45%
Costa Mesa -10.73%
Top Cities with Highest % of Average Rent Price Decreases (April-May)
Destin -7.01%
Rosemary Beach -6.28%
Orlando -4.66%
Winter Garden -4.66%
Costa Mesa/Los Angeles/Ventura County -4.05%
Top Cities with Highest % Increase in Vacancy (April-May)
West Palm Beach 1.00%
Cleveland .60%
San Jose .60%
Knoxville .50%
Tampa .40%
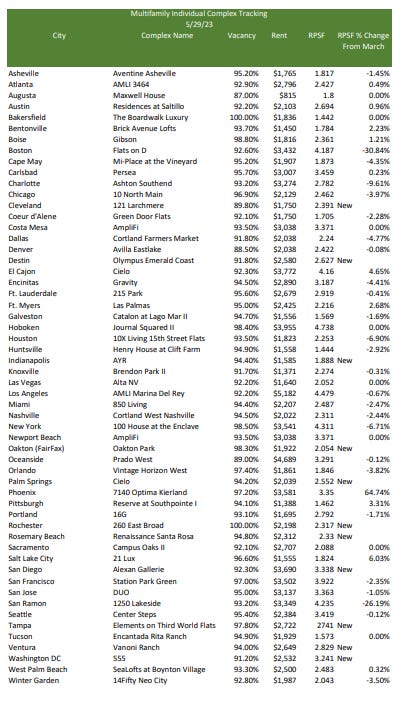
Top Cities with Highest % Decrease in Rent Per Square Foot (RPSF) for Specific New Multifamily Complexes (March-April)
Encinitas -3.57%
Ft. Myers -3.56%
Asheville -3.20%
Tampa -1.76%
Boise -1.09%
Not only are you a great analyst, you’re a great writer.
Melody this was a great read! Hanging with regular working people gives the real perspective on what’s going on with the actual economy. In my area housing stats came out and not much is moving except for houses that pop up under $300,000. No one can afford a big mortgage when you have 2 newer cars plus kids to care for. Auto insurance jumped bigly. Electric bills to increase this month and we have tiered water rates increasing every year higher to pay for aging water system upgrades. Walmart is advertising $14 plus an hour and this week noticed new older faces stocking shelves. My trades people still having a hard time keeping lower level young workers. Hard outdoor work and hot weather they quit within a week. Get this...my freezer went bonkers so called to get a repair appointment to be informed it would be over 2 weeks till a tech shows up. The Appliance Center has only 1 tech that repairs refrigerators. This company is the biggest in our area for appliances.....I really miss SEARS and Kenmore products from the past.
Thanks for all your efforts to keep your devoted readers in the know. You can feel discombobulated as to what you see compared to what you hear and read nationally.
I’m just a farm girl looking through a common sense lens. Nothing adds up.