Another day, another revision at the Bureau of Labor Statistics, erasing 818,000 jobs from initial projections received in March. To top it off the highly anticipated release was mysteriously delayed.
Each year, the Current Employment Statistics (CES) survey employment estimates are benchmarked to comprehensive counts of employment for the month of March. These counts are derived from state unemployment insurance (UI) tax records that nearly all employers are required to file. For National CES employment series, the annual benchmark revisions over the last 10 years have averaged plus or minus one-tenth of one percent of total nonfarm employment. The preliminary estimate of the benchmark revision indicates an adjustment to March 2024 total nonfarm employment of -818,000 (-0.5 percent). (my emphasis)
This bears repeating: “the annual benchmark revisions over the last 10 years have averaged plus or minus one-tenth of one percent.” The difference in these revisions are a -.5%. Golly - that’s quite a difference. Although the rest of the market had to wait for this news, three banks got the information ahead of time, giving them a head start on trading the move. Never fear, though, when results were announced, the stock market delighted with glee as the case for rate cuts in the back half of the year became cemented (in their minds) with the news, illustrating that those who proclaimed that “bad news” is bad news again perhaps did not realize the extent of the current mania, or just how much juice is left. The fact that we have almost a million less jobs than we thought we did in March should make you sit up and pay attention. Unfortunately, most will never even read that news in mainstream media. They will continue to toil and struggle and wonder what is wrong with them. When asked, though, they will tell you, as evidenced by a recent survey that showed 3 out of 5 Americans believe we are already in recession.
Gaslighting is the name of the game, and our Forgotten Americans are not winning. Instead, they are being told that what they see in front of their very own eyes cannot possibly be true, that their vibes aren’t vibing right. The increased number of homeless they see at intersections when doing weekend errands, the friends that cannot find jobs, the ever-larger grocery bills, the fact that your cousin is working two jobs to make ends meet….no, none of this is happening. You are crazy, they say, while the money changers count their cush, dancing, as our economy burns.
As we bid adieu to the dog days of summer and a slight chill replaces stagnant humidity, many I think feel uneasy as to what this Fall may bring. As uncertain as the path is ahead, we will all be much better off if we do our best to remain grounded in our purpose as daily shock and awe compete for our attention. Only you know what that is for you, but for me my focus will be to continue to dig into the data and narratives to triangulate as best we can to prepare as the path unfolds, and of course reaping the rewards from my garden.
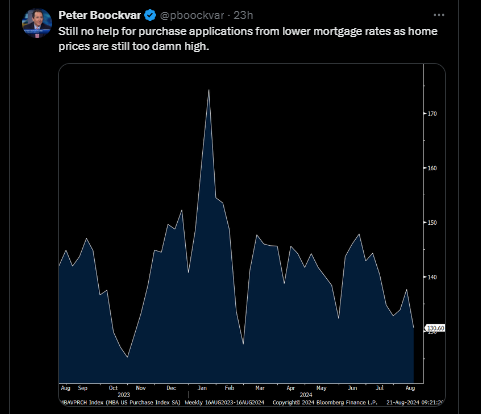
In my last post, I cautioned folks not to get carried away by those drops in rates when it comes to the mortgage market. And indeed, although there was an initial surge in refinance applications, that activity has moderated. Anecdotally I hear that many need credit scores to be a bit higher, or rates much lower to really get the savings that would justify the expense. Don’t get me wrong, we will see a mini refi boom if rates continue to drop, but it will be for all the wrong reasons to cover previously pulled-forward demand (debt consolidation). Purchase activity though remains depressed. Since May 2, mortgage rates have consistently moved downward from 7.22% for the 30-year fixed to 6.46% as of this writing. So what’s the deal? The deal all along as I’ve been saying are the home prices. Rates don’t help affordability obviously but seriously who can afford these increases in property taxes, insurance and repairs - or in other words, the cost of home ownership?
Just to repeat for the millionth time, the median income in the United States is roughly $80K. The median listing price in the United States according to FRED/Realtor is $439,950 (which is down -2% from the peak in June of 2022 and -1.13% MOM). With that median income, you could potentially afford a home priced at $325K if you had a 20% down payment, less than $250 in other debt costs (definitely not a $1K car payment) each month and at least six months of reserves. If you don’t have those things, you can afford much, much less.
This is where we all need to stop and pause, drown out all the noise, let go of the zestimate that we hold close to our hearts….who is the buyer at these prices? It is not Wall Street. They have largely become net sellers, and those that haven’t will soon be as it just does not make sense to hold these expensive assets. Foreign buyers have also pulled back by 36% from April of 2023 to March of 2024. The sovereign wealth funds have definitely pulled back. I know because they were yammering at my door last year for help identifying markets. Mom and Pop foreign buyers have also pulled back as trouble at home is increasingly getting hard to ignore as we discuss in our last episode of DNN. Individual investors also seem to be getting the memo as in the existing home sales that were published today, investment and 2nd home properties decreased by 3% MOM and YOY to 13% from 16% in June 2024 and July 2023. So that just leaves our government, the Forgotten Americans and the top 20%. And how is that going? Although the Harris campaign made waves with her housing proposals, the reality is we still have $5B in downpayment assistance floating around. And anyone with a 580 credit score and a pulse is being enticed by FHA and low-rate offers. Just ask Lennar:
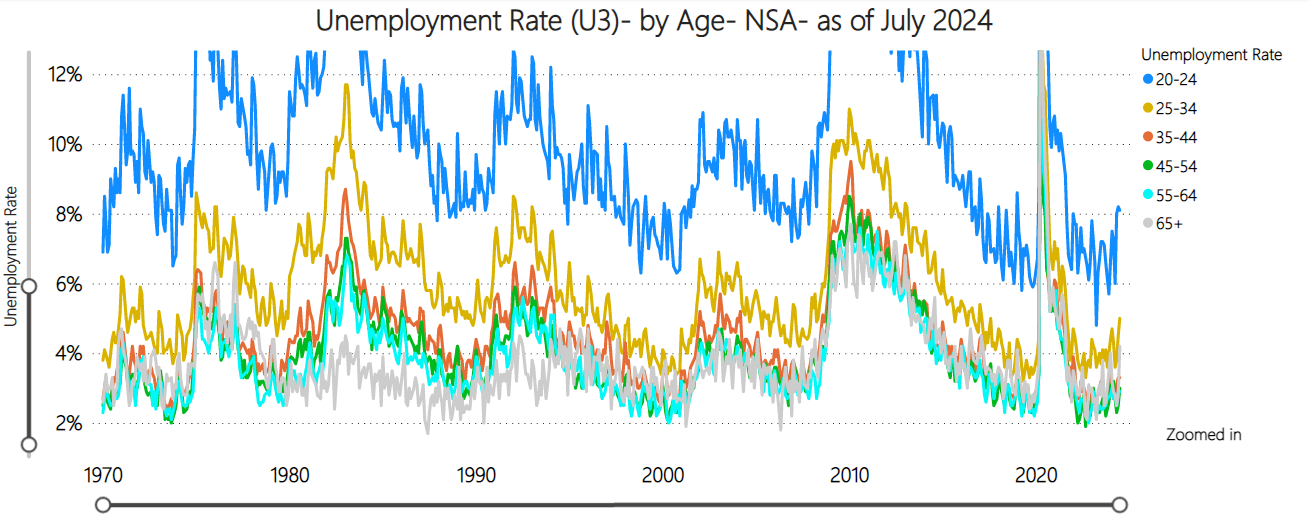
While Boomers look for “Boommates” to help with rising costs, our millennials and Zers struggle to find work. Every time I talk to a housing bull they mention how many young people will be entering the market to buy.
Graph courtesy of KennyCap_PhD
The unemployment rate has just started to rise, but the youngest amongst us are not doing so well. Additionally, according to Harvard, we pulled forward demand during COVID. And, I have a sneaking suspicion that by the time we get actual updated Census results, we will see that our current average of 2.6 folks per household will increase as we move in aging parents and children who cannot afford their own apartment or home. Or in other words, that household formation that accelerated during the COVID boom will curl back up in a ball.
Speaking of those existing home sales published today? My forecast was for 385,000 non-seasonally adjusted sales based on a historical correlation to the results I get by looking at Redfin data. We came in at 389,000. I also saw prices decelerate MOM as did the National Association of Realtors (NAR). Below I will discuss those results in detail, share my summary table for M3 cities, reflect on the latest delinquency results and tell you where inventory is heading as seasonally it should be decreasing.
Much to discuss, so without further ado….
Keep reading with a 7-day free trial
Subscribe to M3_Melody Substack to keep reading this post and get 7 days of free access to the full post archives.


