

Mood Swings

Anyone else feeling a bit moody? This past week was full of ups and downs with quite a zinger of a surprise on Thursday with that lower-than-expected Gross Domestic Product (GDP) print which came right on the heels of the Census announcement that new home prices had risen month-over-month. Did I forget to mention another bank failure? Schizophrenia much? As I drove through Appalachia to North Georgia to unplug for a day with my family, the scene could not be more lovely: pink rhododendrons, orange azaleas, blue irises and a whole bunch of other stuff I can’t name but hope to be able to soon, splashed across the mountains, contrasted with lush green and deep blue sky. Our dinner at a local diner where the owner came to our table immediately when he saw me putting on my jacket to make sure I wasn’t cold, could not have been more delicious, topped with live music that ranged from “Rocky Top” to “Blackbird”. Kindness, calm, synchrony, fellowship was followed the next day by a hike down to one of the more beautiful waterfalls I’ve seen in some time. My soul felt fed, nourished.
But as I hurried back for a commitment and re-entered the feed, my mood turned darker as I sensed the frustration that has been building as we round the corner to summer, deeper into 2024, closer to November. Accidental analysts are capitulating while followers of fundamentals are frustrated to see home prices on the rise again. Sentiment is the name of the game right now. But isn’t it the season for rising sentiment? Don’t we often get more hopeful in the spring as the days get longer, the flowers bloom while the coats and boots remain tucked away in closets which feels like freedom?
Prior to the little dust-up we’ve had recently, Californians are dancing in glee over their rising stock portfolio, and according to certain commentators, multiple offers is the name of the game again. Hold up, I say. Don’t get roped into the mania, yet again. Insiders got their warning today from Business Insider:

The pandemic housing boom is yesterday's news, along with the intense buying competition it fueled, subdued by a relentless increase in mortgage rates. It means two things for prospective homebuyers: One, more sellers are likely to slash listing prices to attract buyers. Secondly, buyers now hold an advantage over sellers.
Inventory for my cities is up 30.45% in Florida year-over-year and 34.36% for Texas. There is a reason I was in Florida over the summer and in Texas just recently. This is going to be where we see it first. Inventory in other states though is also building for the cities I track: NV at 37.89%, WA at 35.38%, CO at 32.42% and CA at 29.71%.
The article above from today follows Connor Sen’s message from last week that the builders were done. For those not paying attention, these articles are meant to be warnings to our top 20% who pay subscription fees. Although the NY Post recently carried a story on Florida and Yahoo picked up this story, The Forgotten American will likely miss these signs because they are too busy with life - cheerleading tryouts, end-of-school concerts, graduation parties, summer plans for the rugrats who are out of school. Most Moms I know dread the month of May more than any other month.
But, let’s get back to the builders and their sentiment for what it can tell us about what’s happening with those higher-than-expected new home sales we heard about last week.
Much ado was made about this small rise in builder sentiment in March which got us over the 50 mark (barely), but much less was made about the fact that in April that sentiment stagnated for the first time in four months.
Of course this series is seasonally adjusted, so it is hard to say what if anything this signals about the builders. But, I can tell you that since 1985 we have averaged a 55 for builder sentiment according to the NAHB/Wells Fargo Index. This index is
Designed to take the pulse of the single-family housing market. The survey asks respondents to rate market conditions for the sale of new homes at the present time and in the next six months as well as the traffic of prospective buyers of new homes.
If you exclude 2007-2012 when the average was 21, you get an average of 58. Although I often rail against seasonal adjustments, please don’t take that to mean that I do not believe in seasonal patterns. In the housing market in particular there are/were well-defined seasonal patterns due to the snowbirds in Florida for instance, school starting or ending, etc. COVID threw a wrench into some of this, but we cannot ignore that we are in the high season for housing. Last year, according to the seasonally adjusted survey, sentiment rose five points from 45 to 50 in March, one point from March to April and five points from May to June to top out at 56 in July.
The pattern I’m seeing play out in many of these housing metrics where I can get the non-seasonally adjusted data is that we are following the seasonal pattern, but are making lower highs and lower lows, signaling we are indeed in a downtrend.
Let’s take existing home sales for instance. In March of 2023 we sold 359,000 homes while in March of 2024 we sold 324,000, the highest since September. Existing Home prices were up year-over-year, but prices rose by 2.34% between March and February of this year versus 3.22% last year and were 4% below their June high from last year. I would absolutely love to get my hands on more non-seasonally adjusted historical data, but NAR limits what you can get for free. Weirdly, a lot of housing data that you can find publicly only goes back to 2017. NAR has even removed anything prior to 2023 for Existing Home Sales on FRED. If anyone has this non-seasonally adjusted historical data, it would be much appreciated as I don’t feel like shelling out $1,500 to NAR.
What I’m starting to notice about some of the seasonal adjustments is that they currently seem to exist primarily to adjust how far off the initial estimates are. If you look at the pattern in the seasonally adjusted estimates in existing home sales it is very telling:
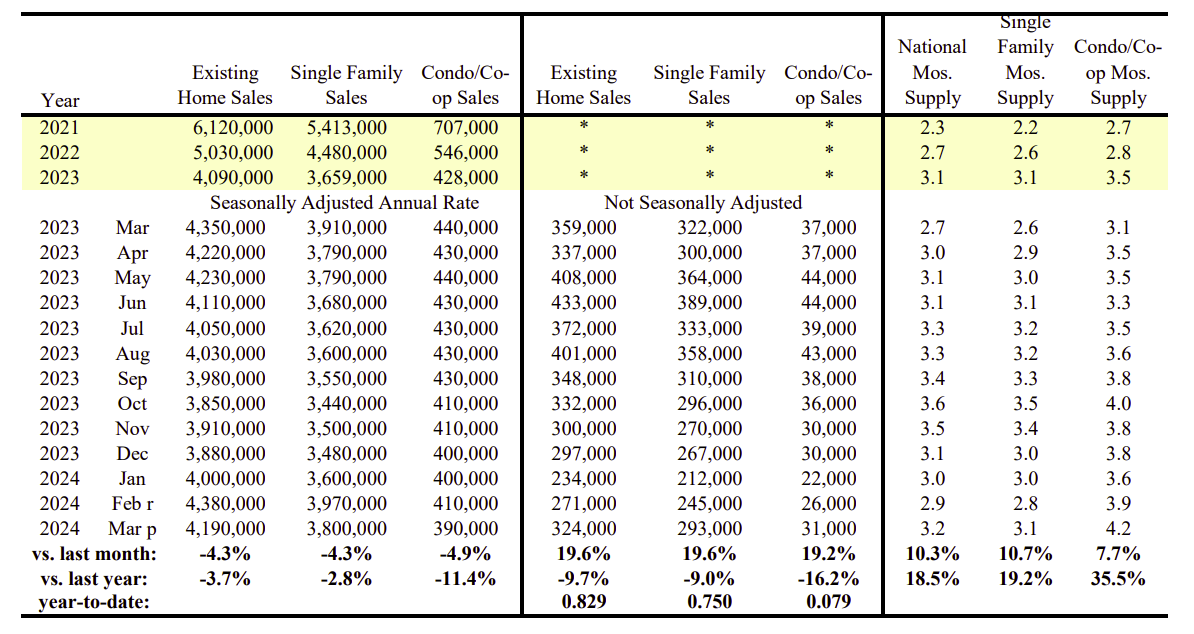
The peak in existing home sales came in June of 2023, but the highest annualized number we see was in March. What I would do to get my hands on that model, but I digress. When turning to new home sale data we got this week, there was much surprise by folks like Zelman who had been reporting decreases in traffic at builder sites. Although the series is very volatile, I think their limited reach into regional builders starts to show its lack of efficacy in times like this. As many may or may not know their research relies heavily on a survey from the builders. Some of you have heard me say before that the builder group was the holdout in the last cycle at my company. They believed everything was excellent until it wasn’t. But, then I heard Todd Sachs, an independent builder, in an interview with Adam Taggart talk about how some builders knew before everyone last cycle. Could the national builders have reported lower traffic even if it wasn’t really lower based on their expectations? Could the regionals be pushing harder as they don’t have the same access the nationals do to funding? We don’t know, but we do know sales of 67,000 came in at the strongest levels since May of 2023 which was last year’s peak. For reference, builder sentiment (seasonally adjusted) in May when the peak was reached was 50. Sentiment did not reach its high with the builders until July, even though sales decreased in June and July. With inventory up almost 6% MOM and 25% YOY for my cities, the battle is intensifying between existing homes and new homes as indicated in the article above. Panic has not really set in, but with mainstream media picking up on what is happening in Florida, it may be a matter of time.
But, let’s get back to those new home sales. What did the media have to say about it? Well, it depends:

At CNN the message was “sales surged” while at CNBC they “inch higher”. No wonder we all feel schizophrenic. But, let’s break it down. Additionally, I will be sharing Redfin prices and sales by Census region with top cities below (and a little aside about some weird things I noticed in Redfin data this month). And, to wrap it up for the week, I will include my Austin deep dive and diagnosis.
Keep reading with a 7-day free trial
Subscribe to M3_Melody Substack to keep reading this post and get 7 days of free access to the full post archives.