


Ohana & Weekly Stats

As promised, I’m doing a second post this weekend to publish last week’s stats. And, at the same time, I would like to take this opportunity to send my prayers to the residents of Lahaina and my condolences to those that have lost family members and friends.
The devastation in Lahaina is truly heartbreaking with recent reports approximating that over 2.2K structures were lost of which 1.9K were homes. Just Wednesday, Bloomberg published an article on the staggering amount of insurance losses in 2023 due to storms and wildfires. It seems we may be on track to a pretty cruddy 2023 for insurance companies. One can only hope that we avoid a hurricane in Florida this season as there is currently a one in four chance that a hurricane this year will wipe out the reserves of Citizens, Florida’s insurer of last resort.
In my post earlier this week I talked about the destruction of a good portion of the Fort Myers short-term rental market (STR) after Hurricane Ian. Fort Myers had close to 3K STRs prior to Ian and less than 900 as of July. Lahaina had approximately 6K STRs listed in July. Based on those photographs and videos, this will likely have significant impacts on the finances of many. When I posted that there were over 6K short-term rentals in Lahaina I inadvertently found myself in the middle of a conspiracy theory that included direct energy weapons. Though not my intent, I do find it very interesting that many are so distrusting and that the anger is building against short-term rental. And with videos of other high-value real estate catching fire circulating on social media I probably shouldn’t have been surprised.
For today, I want to focus on the word Ohana - which literally means family, but in essence means so much more than that. Ohana can be extended to blood relatives, your neighbors and friends and is also meant to connote the lengths one would go to help that family in the face of challenges.
I hope that today wherever you are, you experienced ohana and more importantly, because of your good fortune extended ohana to someone who may not have even really deserved it.
Until next time…
Stats for the Week:
Listings for Sale
Listings are down week-over-week -.70% when looking at raw numbers, but up .50% when looking at the average.
Top Cities with Largest % Increase in Inventory Week-over-Week (7/30-8/6)
San Ramon 16.52% (up from #2 last week)
Rosemary Beach 12.50%
Nashville 9.96% (up from #8 last week)
Portsmouth 7.81%
Costa Mesa 6.35% (down from #1 last week)
Top Cities with Largest % Increase in Inventory Compared to 8-week Average
San Ramon 26.55% (up from #3 last week)
Rosemary Beach 15.24%
Encinitas 14.45% (down from #2 last week)
Nashville 14.30%
Bozeman 7.32%
Top Cities with Largest % Increase in Inventory from Start (1/1/23)
San Ramon 138.33%
Coeur d’Alene 88.08%
Denver 59.33% (up from #4)
Austin 54.52% (up from #5)
San Francisco 53.79% (down from #3)
San Jose 48.06%
Portland 46.11%
Galveston 41.29% (up from #9)
Carlsbad 36.95% (down from #8)
Nashville 36.64% (booting out Seattle from the top 10)
Rent
This week’s updates include changes in rent metrics from RealPages. As mentioned here previously I have been struck by how little movement there has been using this source, but this month I noticed something interesting. RealPages started including some statistics in its write-up of each city including year-over-year changes in occupancy for all but a few key cities which is telling in and of itself. In case you haven’t seen this, RealPages is currently under investigation by the DOJ.
Average year-over-year decreases in occupancy for the cities I track and the cities that RealPages lists is -1.57%. Some of the key cities that are missing these stats in their write-ups: Chicago, Dallas, Houston, Nashville and Phoenix. Someone has shared a new source with me that I will be looking at next week as well.
Top Cities with Highest % Decrease in Average Rent June to July
Nashville -15.92%
Asheville -13.71%
Coeur d’Alene -11.88%
Destin -10.28%
Chicago -9.68%
Top Cities with Largest Decrease in Occupancy Year-Over-Year
Augusta -3.09%
Tucson -2.44%
Boise -2.30%
Atlanta -2.30%
Indianapolis -2.18%
Notable Mention: Miami - 1.91%
Top Cities with Highest % Increase of Single-Family Rental Listings (7/30-8/6)
El Cajon 26.35%
Encinitas 25.00%
Johnson City 20.31%
Coeur d’Alene 17.17%
Augusta 14.01%
Top Cities with Highest % Increase of Single-Family Rental Listings to Average
Augusta 22.31%
Oceanside 15.01%
Coeur d’Alene 14.57%
Cape May 14.29%
El Cajon 13.33%
Honorable Mention: Nashville 11.62% at #6
Top Cities with Highest % Decrease of Single-Family Rental Listings (7/30-8/6)
Cape May -33.33%
Rosemary Beach -33.33%
Austin -30.99%
Costa Mesa -12.50%
Brattleboro -11.54%
Airbnb
On average, short-term rental listings in the cities I track increased by 1.28% from June to July and 6.02% since January. These moves are consistent with what I’ve been hearing anecdotally on social media…there are still FOMO’ers jumping in, but the rate of that change is slowing from last year. From January to July of 2022, short-term rentals in these cities increased by 23.14%.
Top Cities with Highest % Decrease in Average Rate Compared to 12-Week Average
Rosemary Beach -49.16%
Hoboken -31.80%
Indianapolis - 29.75%
Destin -29.21%
Sedona -19.52%
Top Cities with Biggest Increase in Short-Term Rental Listings Jun-July
Fort Myers 14.35%
Indianapolis 6.53%
Las Vegas 6.43%
San Diego 6.24%
Oceanside 5.32%
Top Cities with Biggest Decrease in Short-Term Rental Listings Jun-July
San Jose -6.37%
Phoenix -5.25%
Portsmouth -4.85%
San Ramon -4.30%
Tucson -4.16%
Top Cities with Biggest Increase in Short-Term Rental Listings Jan-July
Destin 37.32%
Coeur d’Alene 36.71%
Cape May 31.94%
San Ramon 28.99%
Palm Springs 22.49%
Top Cities with Biggest Decrease in Short-Term Rental Listings Jan-July
San Jose -21.04%
Dallas -18.02%
New York -13.39%
Fort Myers -11.82%
Houston -8.53%
Top Cities for Short-Term Listings July
New York 26,809
Miami 14,502
Las Vegas 13,913
Los Angeles 11,765
Houston 11,588
Austin 10,911
Atlanta 10,879
San Diego 10,746
Orlando 9,763
Sevierville 8,816 (knocking out Nashville from June)
Top Cities with Highest Average Daily Rate - June (waiting for July ADR)
Rosemary Beach $787.02
Newport Beach $708.33
Cape May $559.16
Destin $548.57
Encinitas $517.59
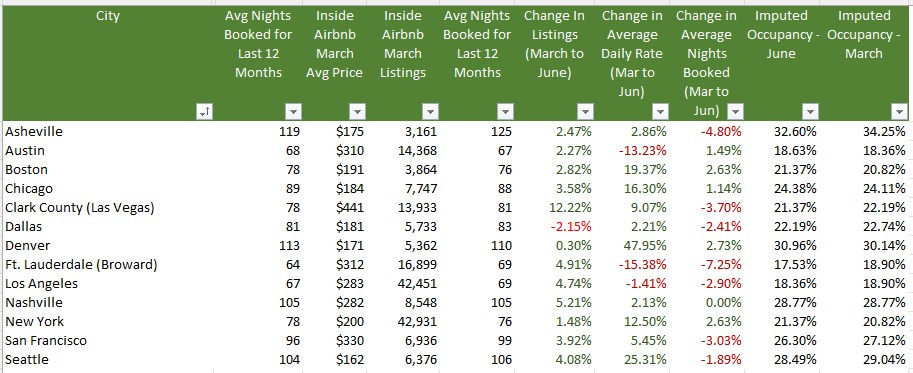
From Inside Airbnb
As I’ve mentioned previously all data is not equal. Inside Airbnb has incredible data, but it is only for a handful of cities and is published once a quarter. Their listings tend to be much higher than the data provided by AirDNA and others, but they trend in the same direction. In October I will do a deep-dive on the differences and trending so we can see how closely the myriad data sources track. But, for example, Inside Airbnb data shows Nashville with 8,993 listings at the end of June while AirDNA has 8,105.
Only one city in the cities they track- Dallas - showed a decrease in listings from March to June which was likely due to the recent legislation. As the stock market took off so did everyone’s hopes and dreams. Unfortunately, I believe that not only will legislative efforts start to tick up (Airbnb’s lawsuit against NYC was dismissed last week), but the sentiment will likely sour in the next months based on macroeconomic clouds that are gathering.
Commercial Real Estate (CRE)
Last week we heard big banks were trying to dump assets, but were running into trouble. This completely tracks with what I heard right after the SVB collapse. From colleagues in the industry, I heard Chase was quietly shopping some assets and there were sales with over 40% haircuts, but we heard nary a word about it in social media. Those sales will be buried in financial statements and unless you are one of the ones bidding, you will not know.
And, the notorious WeWork popped back into the news. I really have nothing to say about WeWork except it is a true lesson in mania and that the supposed best of the best can be conned.
Going to keep this incredible podcast with Jack Farley, John Toohig and Randy Woodward in this section until they do the next one - it’s just that good.

Per John, the only commercial real estate trading at the moment is for Trash and Trophies and despite MSM narratives trouble is on the horizon. Miss this at your own risk.
Reference articles:
WeWork Risk Seen in Commercial Mortgage Bonds, Barclays Says (yahoo.com)
Big Banks Are Trying to Dump Commercial Real Estate Debt As Pressure Mounts (businessinsider.com)
The Commercial Real Estate-Small Bank Nexus | ZeroHedge
Local Malls, Stuck in ‘Death Spiral,’ Plunge in Value - WSJ
Troubles for Wall Street office tower worsen as foreclosure looms (nypost.com)
Understanding the challenges in the U.S. commercial property market
Commercial Property Investors Huge Office Bet is Unraveling In London, New York and Paris
Commercial Real Estate Reset is Causing Distress from Sand Francisco to Hong Kong
CRE’s Strains are contained: But in a recession the dam won’t hold. (contained you say?)
Big commercial real estate downturn could sink 300+ banks: Report | American Banker
Westfield Gives Up Downtown San Francisco Mall (sfstandard.com)
Goldman Sachs CEO Solomon warns of commercial real estate write-downs (cnbc.com)
Hotel Owners Start to Write Off San Francisco as Business Nosedives - WSJ
Sunbelt Construction Boom Threatens Top Apartment-Building Owners - WSJ
US banks prepare for losses in rush for commercial property exit | Financial Times (ft.com)
Interest-Only Loans Helped Commercial Property Boom. Now They’re Coming Due. - WSJ
Coming Soon: Whatever I can manage :). It’s been a crazy summer, and I still have to make a living, so I will do my best over the next several weeks as I try to do more local Florida research and keep my finger on the pulse of macro.
I'm surprised the knock on effects from the low number of new home purchase transactions hasn't hit the economy harder yet. Prices may not be falling much. But when you have 30-40% less house sales than you had a few years ago in many markets??? This has to be hitting other parts of the economy. That hits realtors, loan officers/processors/underwriters, escrow companies, title insurance, furnishings, etc... hard.
I was in the conventional mortgage lending business from 2001-2015, and we had some months where business dried up, but never was it as bad as it must be today for mortgage companies. Purchase transactions down 30%-40% year over year, and refinances have just plummeted. I would expect to hear about a lot more layoffs in the mortgage industry. Realtors must be starving. This has to be a depression for realtors, LO's and their staff, escrow, title, appraisers, etc...