


It’s FOMC week, markets are jittery and fundamentals are weakening in many sectors. Sentiment seems to be rising to a fever pitch from bulls and to the downside for the most extreme bears. Are we setting up for a serious Santa Rally in the stock market or something much more dire? For me personally, I have learned that momentum and the desire to end the year up for bonus purposes can be strong motivators to keep the party going at least until year-end. But, that doesn’t mean that I’m not worried by what I see in the stock market especially in context of what’s happening globally due to a collateral and credit contraction. Caution is prudent in the weeks ahead as I think winter might be a bit chilly next year.
Our focus of course is the real estate sector and things are going to get interesting if we continue to see the 10-year and mortgage rates decline from here. We’ve met some resistance so unless one of our friends abroad decides to do something cray or we have some type of credit event, I think we may sit for a minute. If that is the case then we will see some moderate increases in activity both from a purchase and refi perspective. The marketing for downpayment assistance and risky (yes, I will say it) government programs is on steroids as everyone tries to find those who can keep the machine going for a bit. But, as I argue in a video which will be live soon, pushing people into homeownership before they are ready means that their chances of future homeownership is jeopardized. The ability to afford a home or repay a mortgage doesn’t not mean you can “just” cover the payment, insurance and taxes. You have to be stable enough to afford pretty meaningful miscellaneous expenses. For new buyers, that means being able to put at least $500 a month in savings, in my opinion.
For this week’s Stack, I will be including two guest contributors from around the way with boots-on-the ground perspective and local expertise in the Sunbelt who are also concerned about what they are seeing in the housing market. I will be traveling north of Richmond this week, but will have the deep-dive on Denver out to everyone by the beginning of next week.
Until then, I hope you enjoy these tales from eye-level, one from North Florida and the other from a Nashville native about two phenomenon’s from this recent boom: single-family Built-to-Rent and short-term rentals (STR).
Our first tale is from a Floridian and colleague I met on Twitter who is a 14-year veteran in housing with recent and relevant experience in the Built-for-Rent space. As many of you know who follow me on xTwitter and YouTube, I believe all eyes should be on these Sunbelt markets, especially Florida and Nashville. Please meet Mr. Joshua DeDecker, a Housing Market Realist:
Confessions of a Housing Market Realist
Joshua DeDecker
When people hear my takes, some assume I’m forecasting doom for the real estate market. That's not the case.
With 14 years in the housing sector and experience building the largest rental portfolio in northern Florida, I've got some perspective. And yes, being married to a real estate broker adds another layer.
In 2012, we bought our first home from someone affected by the housing bubble. Four years later, I was orchestrating the acquisition of thousands of single-family rentals.
Throughout this journey, my chats with investors, builders, and other industry insiders were eye-opening. They reminded me of a simple truth: if we ignore history, we’re destined to repeat it. So, I've always stayed alert to shifts in the industry climate.
My stance on real estate? I’m a realist. I cheer when the data is promising and turn cautious when things look dicey. My perspectives are carved from a blend of data, both qualitative and quantitative, and firsthand experiences. Don’t forget some canary in the coal mine anecdotal evidence mixed in.
I emphasize the local over the "national" in my real estate assumptions. The market is so diverse that one neighborhood might boom while the next stalls. Using local trends to paint a national picture? Not my style or expertise. I prioritize firsthand, ground-level reconnaissance over broad generalizations. This hands-on approach often reveals insights missed by mere data.
Being a trained forward observer has fine-tuned my knack for spotting trends early. But this ability is a double-edged sword. While I trust my insights, I’ve learned the hard way that it's essential to back up hunches with solid evidence before making any moves.
In the dawn of 2022, Q1 to be exact, local contractors and SFR operators hinted at a shift. They, who had been fervently buying as fast as possible for years, suddenly pumped the brakes. One operator, managing the rehab of an astonishing 250 single-family homes monthly, virtually halted new acquisitions overnight. This abrupt pause was my first signal.
Concurrently, my wife and I were mulling over the fate of a short-term rental asset in our collection. With operating costs rising, daily rates plummeting, and an unexpected saturation in the working-class housing sector of the short-term rental market, the usual post-off-season uplift was absent. Even with my operational prowess, the decrease in returns didn’t seem worth the increased risk. This deviation from the norm was my second signal.
Seeking external input, I attended a local real estate meetup. My concerns, backed by data and market trends, were met with skepticism, even mockery. Undeterred, we chose to divest from that particular asset. But the listing revealed another change. The property lingered, devoid of the traction or the bidding wars common just a month earlier. As interest rates began their ascent, we had to adjust our price tag to find a buyer. That was the third signal.
Simultaneously, my wife encountered a situation where a recent client wished to relist a freshly purchased property. Knowing the area and its rental prospects, it seemed clear to me that the buyer would struggle to balance the books if they opted to rent. Coupling this with our experiences and the brewing economic shifts, I cautioned of a potential loss for this now seller—a prediction that materialized after several months and price adjustments. That became the fourth signal.
These indicators painted a clear picture for me: the once-sizzling market was cooling down. The change was palpable, not just in a specific asset class but across the board—at least, within my local sphere.
By 2023, investor interest in single-family homes had notably waned. Short-term rentals (STRs) faced dwindling demand, and both the days-on-market for long-term rentals and their inventory expanded.
Once the second quarter data surfaced, these signs became undeniable. Eager to understand better, I turned my gaze towards an often-overlooked sector—new construction and more specifically, build to rent.
With my recent background as a Build to Rent operator across the southwest, I was attuned to the markers of insatiable demand. Just a year and a half prior, demand was so high at a time were labor and materials were in short supply, site construction teams would move appliances from unit to unit in order to satisfy inspection needs to obtain certificates of occupancy. Rental increases were a staggering 1-2% every week for available inventory and there were no concerns about days on market despite the sizable rate increases.
As we journeyed into the third quarter of 2023, leading figures in macroeconomics and housing analytics were garnering attention, particularly with their national housing forecasts. "Airbnbust" had made headline rounds, and concerns about new construction trends were budding.
It was then that I came across Melody Wright on Wealthion’s YouTube channel. She offered a fresh viewpoint, grounded in her experience of handling bad loans during the previous housing crisis. Her macro insights struck a chord with me, prompting me to establish a connection. To my delight, not only did she respond, but we also found the time to engage in a deeper conversation. Post our discussion, she kindly invited me to write for her Substack. So, here I am.
It became clear that my approach was similar to Melody's. We both harbored reservations about the current metrics related to new housing—both their accuracy and timeliness.
Melody's knowledge of builders' strategies was invaluable, particularly when I juxtaposed it with my 'build to rent' experiences to grasp the broader context. We both prioritized firsthand observations, placing great importance on on-site intel.
For instance, in my experience, project managers, who are closer to the action, often had a more accurate sense of delivery timelines than what's relayed up the corporate ladder. In the construction domain, there are two perspectives: what's perceived and what's real. It's an insight I've now come to understand that applies universally, especially within large, investment-driven entities.
Let me be clear: I bear no animosity towards investors. My capitalist heart beats strongly. Yet, expansive investment, if unchecked, might inadvertently sideline the consumer it purports to serve.
Post-discussion, a drive further ignited within me. The streets beckoned—ground reconnaissance needed. Mission accepted.
In my quest for clarity, I plunged deep into construction and population data, traced every budding build-to-rent construction site within my grasp, and set out to gather insight. For those on the brink of development or in active lease-up, I meticulously examined their absorption patterns. After several weeks and drawing my expedition to a close, here's just a snapshot from my exploration of 11 distinct build-to-rent locations in and around Jacksonville Florida:
- Selective Showcasing - It's a trend I've observed in new builds. But given the frenzied climate of the build-to-rent sector, it was startling to see only a minor chunk of available units openly advertised.
- Uptake Disparity- While urban cores showed resilience, the broader spectrum reveals many locations battling leasing challenges.
- Luring Tactics - The wave of concessions and referral bonuses is a glaring red flag. Operators' desperate attempts at enticing tenants underscore evident inventory hurdles.
- Townhomes: The New Darling- An understandable pivot, maximizing unit yield and concurrently reining in construction costs. But is that what the consumer wants at inflated prices?
- Affordability: A Rare Commodity - Grounded in the local wage metrics, the stark reality is the dearth of truly affordable units. Only a sprinkling seems attainable for the median family.
Peering into Jacksonville's housing horizon, I confess, my personal and opiniated forecast isn't doused in optimism. But here are my confessions as a housing realist.
Grounded in empirical data, hands-on observations, and local pulse-checks, it's plausible we're teetering on an inventory precipice—potentially overshadowing national narratives. Absorption and affordability loom large among my concerns.
Casting a broader lens on the national housing tapestry: storm clouds may gather, and certain areas might find themselves revisiting past pitfalls in the face of looming market adjustments.
The overzealous construction, whether driven by off-mark forecasts or unchecked speculation, could very well be a catalyst in this unfolding narrative. I am unconvinced of a housing shortage.
Predicting the future? Not my forte. My compass? Present markers.
While others smarter than me can define the broader market's future, I find solace and insight by keeping my focus local, navigating the familiar alleyways of my own backyard. After all, true confessions often resonate best when grounded in home truths.
While I abstain from doling out financial counsel, my axiom remains: Buy if necessary; patience if not. Ultimately, my vision is consistent: championing affordable housing for all.
Thank you, Joshua!
And for those who want a visual of Joshua’s reconnaissance, check out these videos:
https://rumble.com/v3lnzu1-build-to-rent-reconnaissance.html?mref=842xn&mc=46iqn
https://rumble.com/v3mrn54-build-to-rent-recon-surprise-find-hidden-30-50-home-sfr-community.html?mref=842xn&mc=46iqn
https://rumble.com/v3qjdt4-build-to-rent-recon-just-12-mile-away-massive-single-family-rental-communit.html?mref=842xn&mc=46iqn
For our second eye-level view, please meet Kenny Capital from Nashville who shares my passion for data and rabbit holes.
The Man Behind the Mullet
Kenny Capital
If you’re curious who the man behind the mullet is, then look no further. All my secrets will be revealed. Well… not really, but at least I’ll clue you in on who I am, what I’m about, and what I’m observing. That part will be true.
For those who don’t know me, in real life I’m a boring old CPA and a lifelong local of Nashville. And like many folks in this town, I’ve spent the bulk of my career in healthcare, mainly on the provider side. I started out in public accounting, worked in operations for a large national health system owner/operator, and as a consultant for a small health policy research group. It’s been a wild 12 year run thus far- and anyone who’s had similar experience knows the challenges of working in a variety of environments. But it’s exposed me to things I probably wouldn’t have come across otherwise in my career, like relational database modeling. Put another way, I use PowerBI a lot. Because. It’s. Awesome. Right @MrAwsumb?
My love for all things PowerBI started when a client gave me a very open-ended deliverable. They wanted our small shop to track private equity healthcare provider deal flow- by location (retail, ASC, UCC, Hospital etc.), by provider (NPI#s), pair it with deal terms, claims data, demographics, and other economic data- the list goes on. Some serious heavy lifting at the time- quite the learning curve I must admit, but now I think these tools are the greatest thing since sliced bread! And if you want to get real frisky, pair it with some webscraping and you’re off to the races!
So I bet you’re wondering what this has to do with real estate right about now. Well, I sort of stumbled into the business over the past few years- really just as a side hustle- by way of some small, local single-family developers who needed help doing what I would consider basic things: pro formas, pitch decks for private investors etc. And several of my close friends and colleagues as well as family are in the business.
I guess that was enough motivation for me to get my real estate license. Well, really I just wanted access to the data to make sense of it all after COVID. That’s the kind of person I am. I like looking into things. And I tend to think things like GIS and webscraping can really bring these issues to light. But I’ll let you be the judge.
So that’s how I got into the business, and why I’m here- maybe I can help make a bit of sense out of my local market, especially those pesky short-term rentals (STRs) that keep popping up everywhere. And I have no doubt there are other markets with nearly identical dynamics playing out as well.
With that in mind, a quick history lesson on Nashville’s real estate market. What people seem to forget is that home prices only fell roughly 10% peak to trough in Nashville during GFC (depending on how it’s measured), whereas it was a different story altogether in a place like Miami (~49%). That’s a lighthearted way of saying local developers really have no concept of price discovery, even more so than a lot of other cities.
Now I’ll be the first to admit Nashville was a different town back then- our mix of labor, industries. You get it. But right around 2015, we really started to own the Vegas 2.0 reputation. Fast forward to 2021 on the back of unprecedented COVID stimulus, and it’s been nonstop bachelorette parties and construction- on steroids. Sure, we’ve had a steady stream of tourism and development before COVID, but not like anything we’ve experienced over the past couple years. I think anyone who’s halfway paying attention realized it’s not normal for housing prices broadly to go up 40% across most MSAs in unison over a 2-year period. But liquidity is a powerful thing, however you measure it- ODL or via the Fed’s Balance Sheet (Total Assets – (RRP+TGA)). Either way, the trend is the same.
ODL Shown Quarterly

Net Liquidity Shown Quarterly

Consider that the stars had to align for this to play out the way it did. COVID happens, there’s stupid amounts of stimulus, work from home becomes the norm, lockdowns end, and suddenly everyone wants experiences. Just look at BNA passenger data compared to the national trend. As you can see Nashville clearly outperformed.

We also experienced major migration changes that to me don’t appear sustainable. Of course, TN was not alone- this is why I spend a good chunk of my time focusing on the southeast. Lots of folks decided to move to a cheaper cost of living state, and maybe get their own space. Notice the migration/household bounce 2021-2022? In addition to the dynamics I’ve already described (and ones I’ll get to shortly), I think it’s fair to say these major components have broadly buoyed prices.

And I hope a county level view of net migration for the more populous components of the MSA can dispel the myth that 100 people are moving to Nashville every day. I’ve been hearing people say that for the past 10 years and guess what? Davidson county’s population growth has been slowing really since 2012. And nobody in Murfreesboro, Dickson, or Thompson Station considers themselves a Nashville resident. It’s easily a 35–45-minute commute on a good day with no traffic to downtown from these areas.

So let’s be clear on what this is- an extreme case of demand pull forward. The sugar rush is wearing off and you can clearly see it in the data. Pick your measure- JOLTS (TN below), jobs report (Nashville MSA) state jobless claims. It’s all saying the same thing. And it jives with national trends. Shocker!


You can even see it in things like hotel bookings, and even short-term rental (STR) transactions. That last bit is why I’m really here, but it’s all connected to the much larger issue of supply, demographics, investor trends, lending standards and so on.
But before I move onto the meat and taters that is short term rentals, I can already hear people saying, “Kenny why are you picking on your home town? You’re seeing what you want to see. You’re just an STR, cowboy boot hater!” Am I? Or did I just happen to be in the right place at the right time to have a front row seat to all this? You decide:

Now, would you believe that even though we are seeing sales volumes fall here locally, STRs actually make up a larger share of those units? See for yourself (search parameters outlined next to the chart).
Let’s be clear- when I say STR sales, I’m referring to properties that were either previously permitted or are eligible for said permitting. In other words, these are properties that are being actively marketed as short term rentals through MLS.

Source: TN MLS/Realtracs
The question I get a lot is how are these STRs identified? Short answer- it requires digging and I’m certainly not going to give away the particulars, but it can be done at scale if you know what you’re doing. I’d also like to point out that there are no standardized reporting requirements for these properties, at least for my local MLS. Or really any MLS that I’m aware of. Please let me know if it exists, seriously.
And just so we know my sampled area isn’t just some anomaly, the trend is no different county wide and there are clear signs of softening demand:

Source: Redfin- monthly county level data thru Oct 2023
Moving on: now that we see inventory is rising locally and Nashville has a lot of STRs relative to other cities, let’s talk short term rentals within the context of the framework I just laid out. If you follow any of my content on twitter, you probably know I post routinely on the issue, because like other cities in the country, it’s choked off our already constrained housing supply.
And just because short term rentals only account for roughly .8% of all US houses does not mean they are evenly distributed across all cities. In fact, it would be completely irrational to assume that to be the case. Here’s what the current mix of housing units looks like (for reference, national homeownership or occupancy rate for homeowners is on average 64.6% according to the Census):
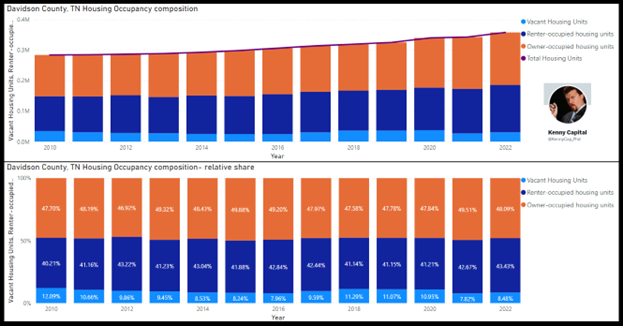
Source: American Community Survey- 1 year estimates
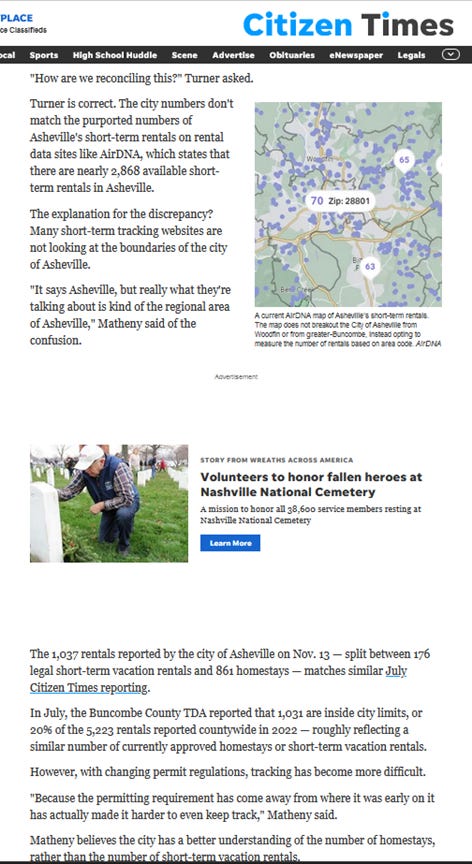
I’ve said it before and I’ll say it again- by my estimates, STRs have tripled as a share of Nashville/Davidson County’s total housing inventory since 2015. It’s roughly 1.8-2% of what’s legally permitted, but for those of you who pay attention to this stuff, the real number is undoubtedly higher. Why? Because they’re loosely, if at all regulated by local municipalities. Only now are they being scrutinized and for good reason. Ask any local authority how they reconcile STR permits to the listings on various websites like AirBNB, AirDNA, AlltheRooms etc. to what they track (if at all) in house. It’s very much a gray area.
Just check out this snippet from Asheville- at least they’re acknowledging there’s an issue:
Taking it a step further, we can even get more granular with the data and see how it’s impacted certain zip codes over time. Let’s compare a couple: 37206 vs 37203. Notice anything about the slope of active permits Post COVID? Yep- another sign of demand pull forward. Imagine getting into the game late 2021-2022 and your property was priced based on DSCR valuations. Obviously people are still buying these properties to this day- always encouraging!


Source: MLS/ACS 5- year estimates through 2021 only (1 year estimates not available at the zip code level thus 2022 not shown)
Now is it possible realtors could be running comps unknowingly against these STRs? And could that also contribute to higher prices across all properties (STR/Non STR)? I certainly think so, considering there is no designated field in my MLS for STRs as I pointed out earlier. These properties must be identified by digging into the weeds of the listing data. Notice the trend in STR vs Non STR comps and the overall STR permitting trends.
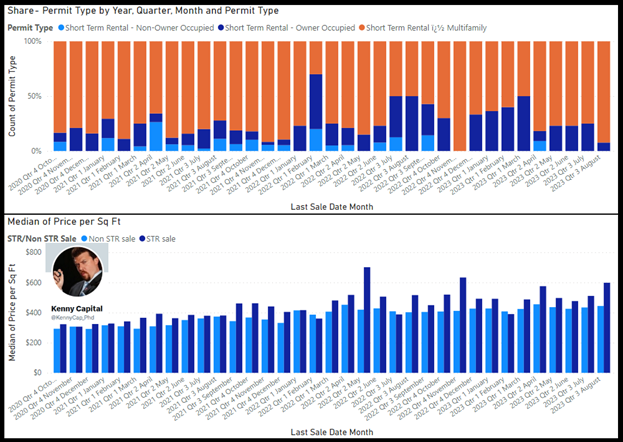
And as I’ve pointed out previously on twitter, it’s the larger STR properties that have been seeing the most weakness thus far.
Now bear in mind, we also have to consider who owns these STRs- the largest permit holders are all for the most part concentrated immediately downtown- think 37201/37203ish. These could be entire buildings designated exclusively for STRs. Hundreds of permits between a handful of professional operators. That’s not who I’m focusing on for the sake of this analysis. It’s the 1-5 unit owners who are at risk the most here, and if you look at transaction data over the past few years, they make up the bulk of buyers. On top of that, their listed address is within the state of Tennessee. Full disclosure these could in theory be PO Boxes for remittances and such, but the majority of these addresses are personal residences.

Tennessee is in brown
Also notice the various types of permits around Nashville:
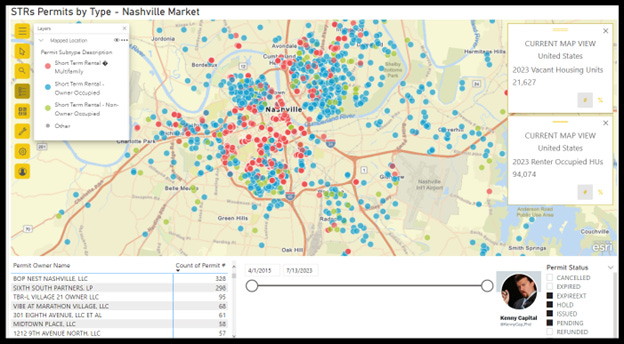
Points represent clusters of permits of the same type
So what’s the point of all this? Why care? Home affordability has never been this bad in the US- ever!
I mean heck, even investors are trying to get out of the way of what they see on the horizon and it ain’t pretty.
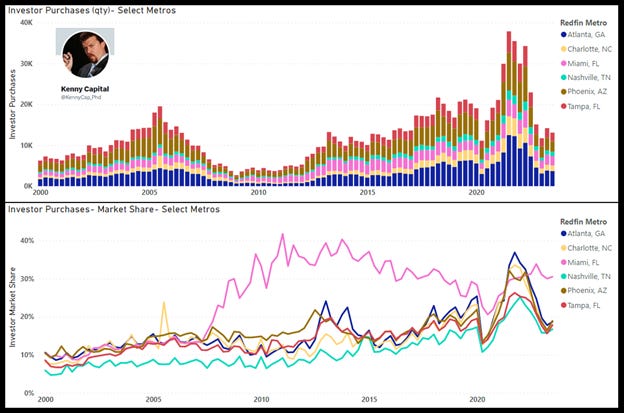
Source: Redfin
So at this point I think it’s fair to say that short term rentals are only one component of the affordability/supply issue, but they are material nonetheless.
Here’s what I know- continuing jobless claims are in an uptrend in virtually every state, which means people will start spending less. And when they do spend, it will likely not be on the same things they used to shell out for such as that trip down to the honky tonks on Broadway. As bookings fall, this squeezes already overpriced STRs, especially if they were purchased recently which means the owner might be forced to sell. Is it apocalyptic? No. But it does represent one of many vulnerable pockets of inventory that could make its way to the market. For context, right now Davidson county inventory is virtually back to pre-Covid levels and looks like it will break higher from here. Is that a coincidence? I think not. Been a broken record on this for a while now.
History also shows that migration slows in a downturn. Generally speaking, people can’t relocate as easily when they lose their jobs. Think about a rent/mortgage application as an example. On top of that, Nashville’s labor force is structurally more cyclical than it used to be- ask yourself why are so many of the healthcare sector components underperforming the broader markets? As I’ve said before, there’s froth even in things like healthcare. On top of that, Nashville has overbuilt- you can clearly see it in the permitting data. And there’s a lot of multifamily supply on the way. There’s a reason our rent vacancy rate is at 20 year highs right now in the metro area and a lot of properties are offering concessions left and right. Imagine the deflationary forces that creates for both rents and by extension home prices.
So when we add it all up, I guess it is different this time. Different in that home prices and our local economy will likely be hit harder in this cycle. Doesn’t mean the world is coming to an end, that’s just what the data suggests. Course we will not be alone- lots of overbuilding and similar dynamics at play in a lot of MSAs. Have I mentioned the wealth effect yet? Look I’m the type of person who would rather know, than not know.
Anyway, that’s all I got. Hopefully there were a few decent nuggets of information in my long winded rant.
Thanks for reading
Shake n Bake!
https://www.citizen-times.com/story/news/local/2023/11/15/asheville-airbnb-usage-increases-57-from-2019-complaints-decrease/71577996007/
Thank you, Kenny! There’s a lot of wisdom hiding behind that mullet.
As I often say, real estate is local, until it’s not. We fed on a national narrative last year of inventory shortages. It’s hard to believe it’s almost been a year since my first trip to Nashville, Austin, Charlotte, Jacksonville, Tampa, Lakeland and Orlando (followed by Las Vegas and Phoenix). But, what’s harder for me to believe is that people still don’t believe what I saw on the road. My hope is by finding more and more local warriors, we can help bring a little dose of reality to the situation because mainstream media certainly will not.
Have a great week everyone and chat soon!
Weekly Updates
This week in inventory we saw some declines (approx -1% week-over-week and -1.2% to the average) which look to be a combination of both seasonal factors and the fact that builders seem to be pulling new listings or strategically placing them on Zillow for instance instead of Realtor.com, the listing site used by the Fed for its inventory sites. Purposeful? We don’t know for sure, but I noticed it in several cities using addresses from the builders.
However, rental inventory continues to increase (approx 5% to the average). Have folks transitioned their listings for sale to listings for rent. I’m hoping to organize some volunteers to dig deeper to know for sure.
Listings for Sale
Top Cities with Largest % Increase in Inventory Week-over-Week (12/03-12/10):
Hoboken 18.75%
Boston 11.89%
Portsmouth, NH 6.85%
Palm Springs 2.36%
Pembroke Pines 2.30%
Winter Garden 1.89%
Orlando 1.70%; Boca Raton 1.42%
Ft. Myers 1.10%
Ft. Lauderdale .95%
West Palm Beach .94%
Top Cities with Largest % Increase in Inventory Compared to 20-week Average (12/3-12/10)
Hoboken 60.16%
Palm Springs 22.99%
Bakersfield, CA 22.59%
Fort Lauderdale 12.88%
Fort Myers 11.58%
Top Cities with Largest % Increase in Inventory from Start (1/1/23)
San Ramon 88.33%
Hoboken 82.19%
Bakersfield 72.55%
San Francisco 43.94%
Galveston, TX (up from #9)
Coeur d’Alene 42.49% (down from #5)
Fort Myers 38.33% (first time here)
Dallas 37.14%
Denver 36.74% (down from #4)
Knoxville 34.66%
Listings for Rent
Top Cities with Highest % Increase of Single-Family Rental Listings (12/3-12/10)
Listings for rent were up .09% week-over-week and by 4.75% up compared to 20-week average.
Carlsbad 11.11%
Winter Garden 8.45%
Palm Springs 7.02% (hmmmm)
El Cajon 6.07%
Encinitas 5.41%
Top Cities with Highest % Increase of Single-Family Rental Listings to 20-week Average
Cape May 33.98$
Sevierville, TN 32.69%
Dallas 29.47%
Knoxville 25.30%
Galveston, TX 25.25%
Top Cities with Highest % Decrease of Single-Family Rental Listings to 20-week Average (12/3-12/10)
Portsmouth, NH -18.16%
Bozeman -9.71%
Boise -9.40%
Tupelo -7.64%
Denver -7.39%
Airbnb/VRBO - Short-Term Rental
Airbnb/VRBO will be tracked monthly only as Airbnb has removed the ability to see average daily rates when searching.
Top Cities with Biggest Increase in Short-Term Rental Listings for October
Sacramento
Austin
El Cajon
Las Vegas
Knoxville
Top Cities with Highest Average Daily Rate October
Newport Beach $478
Rosemary Beach $463
Palm Springs $410
Encinitas $365
Cape May, NJ $365
Commercial Real Estate (CRE)
The headlines are coming fast and furious now and it’s hard to keep up, but suffice it to say things are not looking good.
Big story this week on potential buyout of Macy’s largely for the real estate. I think this is an interesting deal and one to watch. Meanwhile office vacancy is still a dire situation. According to this article, “about 23 percent of office space in the United States was vacant or available for sublet at the end of November, according to Avison Young, a real estate services firm, compared with 16 percent before the pandemic.”
And, as mentioned many moons ago, I believe multifamily will end up giving office a run for its money. You can almost hear the little bombs going off across the sector. Who will be left standing amongst the syndicator ranks? RealDeal discusses here:

Occupancy is increasing across rental everywhere and soon multifamily will start competing with new single-family rental as well as homes built for sale. The builders are going to have to do whatever it takes to move inventory so these two sectors are going to race to the bottom in my opinion.
Until next time….
Great insight from you and your two guests, thank you!
I am in agreement for CO yet so many agents and investors disagree right now even though almost everything they push doesn't cash flow if using 30yr debt.
I’m putting this here since it’s your latest.
Have you heard of First American/ACI being hacked. I’m an appraiser (since 2002) and Realtor. This is bigger news than Mr. cooper and NO ONE is reporting on it. People’s lives are crumbling. Loans are being held up, closings delayed, lots more and NO ONE is reporting on it.
From what I hear, First American was able to recover part of their platform with help from the FBI. However, ACI is still down. Appraisers are pulling their hair out. I’m sure Realtors and closing attorneys are also. This is news! And will have a big impact.