


The Messy, Muddy Middle

Yesterday I took my first drive down and around downtown Miami and boy-oh-boy are there some sparkly spots, especially near Brickell. I had to see for myself this luxury listing pictured below which has been featured first for the past seven months on Realtor.com when you search Miami - listed at a cool $59M with no price cuts (up a wee $9M since 9/3/21).


I usually white-out the address, but what is the point, really? Anyone can see this thing from most spots in Miami: “unrivalled prestige…a select few…uncompromising standards….most inconic….bespoke and handcrafted, making a highly personal statement about the owner who possesses it” (my emphasis).
And that is a lot of the language I hear and the obsessions I see in the more upscale spots in this area - possession obsession. But, before I go there, let’s discuss what I saw from here to there. One of my techniques when I visit any city is to drive “avoiding highways” so that I can get a real sense of a city, warts and charms and all. One thing I think has happened a lot as investors piled in, drooling hungrily, for long-term and short-term rental is that if they even bothered to visit the location in person, they were driven directly to the spot, via a particular path which failed to show the potential pitfalls of their chosen location. This is the only way I can understand how investors could miss that yes, their little spec or even custom-built community was next to a school or event venue, but so were ten more empty subdivisions just down the street and around the corner.
But, surely, they did more due diligence? Don’t call me Shirley, they didn’t. Just read my post from last week if you are unconvinced. My first trip to Austin in February happened to coincide with a visit a colleague from the industry took to the area as well. He was also in search of the real housing story in Austin. We were not able to connect during the trip, but compared notes when we returned. I let him talk first, and I was stunned. He told me about getting picked up by some clients from the airport (he is an executive at a lender), fancy dinners and celebrating his milestone birthday In Da Club-style.
“Wow,” I said. “Did you see all the excess inventory?”
“Say what,” he said.
Suffice it to say, they took him to all the happening spots, but when I started asking him if he visited this area, or that area (even downtown) it was then I realized we were in serious trouble. My trip could not have been more different as I visited not only downtown, but traveled the entire perimeter, including the exurbs plopped in the middle of cow pastures. I stayed at the Courtyard in Georgetown, forgoing the club. In his estimate, Austin was on the upswing.
On my drive to downtown Miami from a very nice area just to the North, I saw a lot of not-so-glitzy things in the middle between the two. And, I saw a lot of hand-scribbled for rent and sale signs. If you are not from the South, you may find it strange to see luxury and poverty so close to one another. I’m sure this can be true of all cities, but I have lived in many cities above the Mason-Dixon line, and I can say that it is always just a little more pronounced in the South. It’s why the nation was so shocked by the images of New Orleans during Katrina. We never quite recovered from the Reconstruction bezzle and when farming went the way of Big Ag the South was no longer the raw-material producer it had once been. No matter how many tax breaks we gave to foreign companies we just could not create enough jobs to truly address the structural issues. This is why all the people that moved to Huntsville when they thought they could work-from-home, but were laid off, now have to move back to somewhere where the median income is a smidge better than the $61K that exists today. Per some recent charts going around Twitter, it now takes a salary of $104K to afford to “buy” a house, much less maintain it.

(h/t - Jeff Weniger)
When traveling for competitions and the like as a youngster, I was often asked if we wore shoes in Mississippi when I had to admit where I was born. I have been extremely blessed in my life and have been given opportunities I never really imagined from my shame spot. But, you never quite shed that shame which is why while I passed in polite society in NYC, LA and the Hamptons for instance, I never saw things the way others did.
Comparing my amazing experience on the road in Wytheville, VA of inclusion to my recent encounters in the nicer areas around Miami I am struck by the palpable anger seething beneath the glamour, similar to the way the septic tanks haunt Kenny G’s fever dream.

(h/t - JuliusMiami)
In a recent encounter while picking up dinner, I overheard two men talking about their younger, trophy wives and how they were so glad they got one of those. One was thrilled theirs was Eastern European because they weren’t as much trouble. The two men, who had just met, easily switched topics in the twenty minutes I was there waiting, from houses to boats to wives to cars - not with joy, but with something that felt like anger. The same anger I sense on 95 as people drive like they want to hurt someone in their McLarens and Aston Martins. And the thing is as I look out from my balcony where I am very privileged to stay, I never see anyone take out the gleaming yachts and speedboats.
But by God, they must possess it, whatever it is. As I drove from Miami to Parkland, FL I was struck by the sheer amount of money that has been poured into the gated communities scattered around Parkland and Coral Springs. And, they are all gated, no matter if they are aspirational or luxury. No need to chase waterfalls either because you will find them in every subdivision, some modest, some very large and grand.


It can be difficult to see what is really going on because of the gates, but I have figured out a new trick….the construction entrance is usually a quarter-mile down the road, just around the back. This rule-follower is becoming just a bit more intrepid.
In this particular subdivision, you can pick up or have constructed a two-bedroom, two-bath for $1.3M. You will be right next to your neighbor and pay 4x the national average for insurance, the 2nd highest auto insurance as well as hefty property tax. I must warn you, you may become angry.
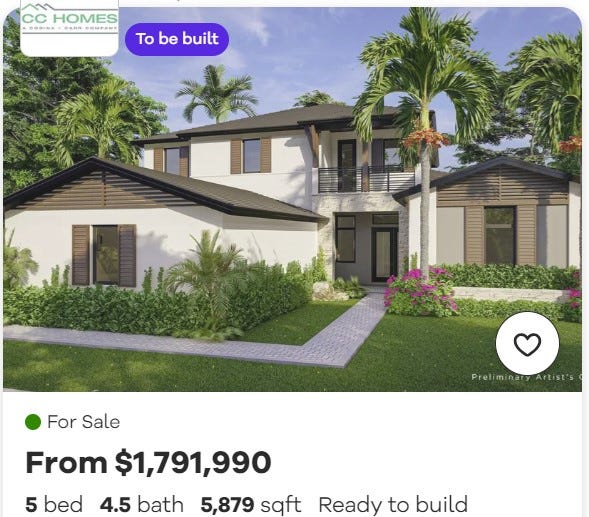
Need more bedrooms? No problem. Down the highway a bit there’s an up-and-coming spot in Davie, Florida with aspirations and a high-falutin’ subdivision that includes the word “Reserve”.
(forgive video quality…let it play to the end to see the full scale…not sure what happened and no time to fix today)
None of these homes are completed yet, but as you stand in the middle of the muddy construction site, just take the rendered photo below from Realtor.com of the “Breeders Plan” to stoke the fires of your imagination.
Just one quick note - please ignore the rather large trailer park a mile down the road.
As many of you know I focus on path, not prediction. There is so much happening, but as credit card debt mounts, insurance costs skyrocket and assessed values cause property tax heart attacks, our path is fairly clear. So, although headlines try to convince us that this time is different (yet again), I think some can sense the tide is turning.

And, perhaps our bill is coming due. We have convinced ourselves that excess can be had without deleterious effects and that there are easy answers, forgetting the majority of Americans that are drowning in the muddy middle, crushed by astronomical price increases in food, shelter and gas. In an excellent Substack from today, Mike Green highlights the incongruence.
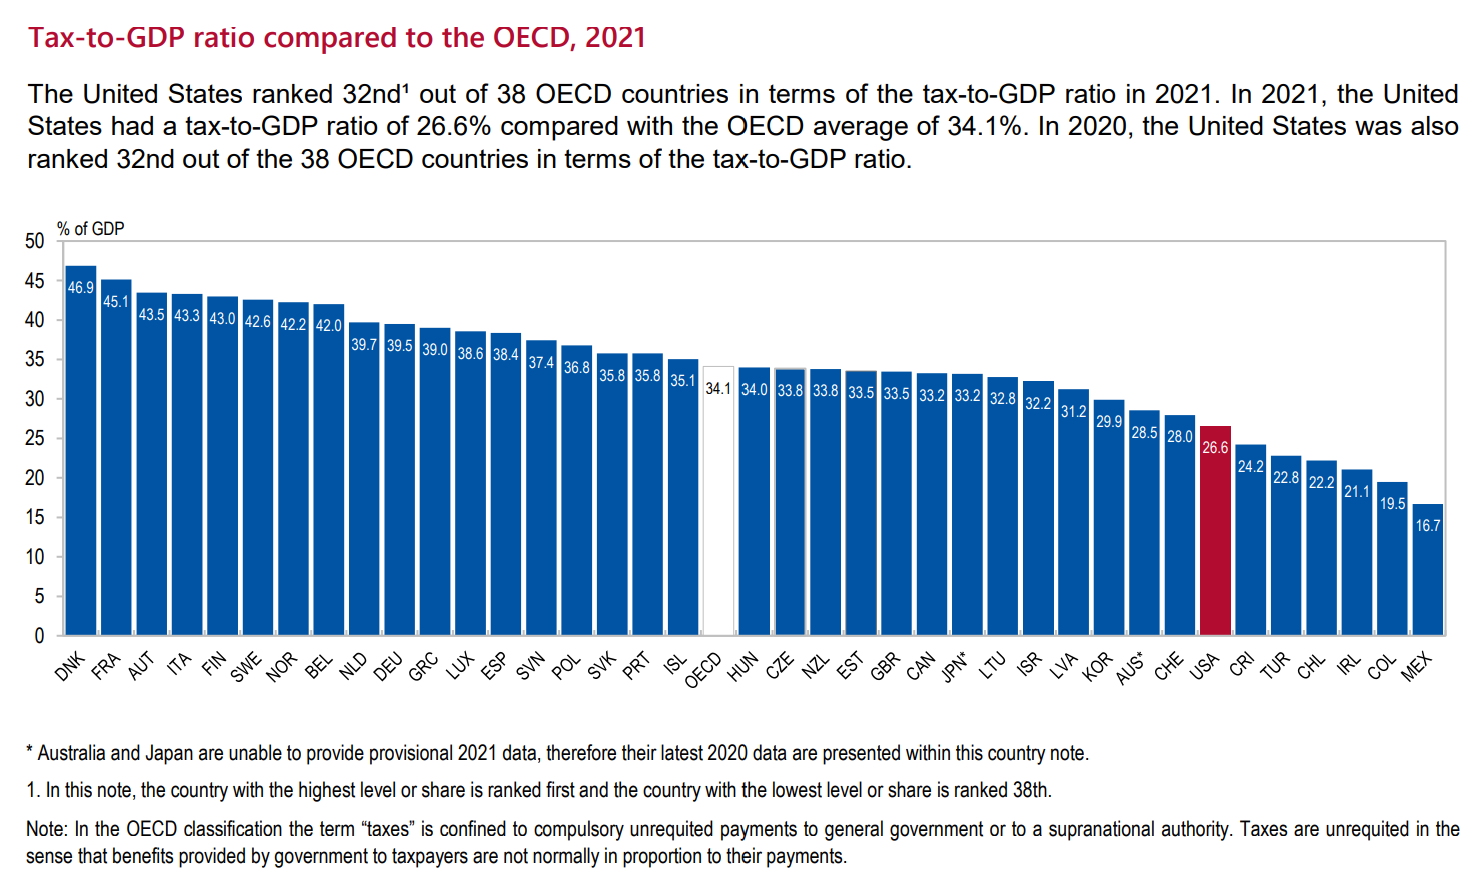
For those doing the math, the obvious conclusion is that US deficits of roughly 6% of GDP can largely be explained by our desire to offer European-style largesse with the taxation of Costa Rica. A banana republic indeed.
Nothing comes for free, or at least nothing to be proud of…
The seeping septic tanks hiding barely below the surface of the glitz and glamour will have to be addressed, as will the consequences of our shimmering largesse.
Listings for Sale
Listings are up slightly week-over-week in the citeis I track for both the pure variance (.65%) as well as variance to average (.78%). Movements are small, but interesting where they are happening.
Top Cities with Largest % Increase in Inventory Week-over-Week (8/13-8/20)
Phoenix 14.42% (I think there was a data issue with PHX - they dropped a few weeks ago, but are now back up to their recent trend - up 14.46% to average)
Scottsdale 11.88%
Nashville 9.08%
Bakersfield 6.39%
San Francisco 4.24%
Top Cities with Largest % Increase in Inventory Compared to 9-week Average
Rosemary Beach 26.24% (up from #4)
San Ramon 14.59%
Phoenix 14.46%
Bakersfield 10.31%
Nashville 10.22%
Top Cities with Largest % Increase in Inventory from Start (1/1/23)
San Ramon 128.33%
Coeur d’Alene 94.30%
San Francisco 60.00% (up from #4)
Denver 59.01% - (down from #3)
Austin 51.39% (up from #6)
San Jose 50.56% (down from #5)
Galveston 43.69% (up from #8)
Portland 42.14% (up from #9)
Rosemary Beach 40.91% (new on the list - kicking out Carlsbad)
Bozeman 39.67%
Top Cities with Highest % Increase of Single-Family Rental Listings (8/13-8/20)
This is getting interesting as we see our seasonal areas move to long-term rental (LTR); but Nashville being here is also interesting.
Rosemary Beach 25% (still moving up)
Brattleboro 21.05%
Encinitas 20.75%
Sedona 14.29%
Nashville 9.48%
Top Cities with Highest % Increase of Single-Family Rental Listings to Average
Rosemary Beach 55.17%
Encinitas 38.83%
Couer d’Alene 22.18% (up from #4)
Portsmouth 20.00% (down from #3)
Galveston 19.23%
Honorable Mention: San Diego 19.23%
Top Cities with Highest % Decrease of Single-Family Rental Listings (8/13-8/20)
Cape May -50.00% (small numbers)
Charlotte -26.00%
Boston -10.65%
Sevierville - 14.29%
Winter Garden -6.10$
Airbnb/VRBO - Short-Term Rental
On average, short-term rental listings in the cities I track increased by 1.28% from June to July and 6.02% since January. These moves are consistent with what I’ve been hearing anecdotally on social media…there are still FOMO’ers jumping in, but the rate of that change is slowing from last year. From January to July of 2022, short-term rentals in these cities increased by 23.14%.
And, in looking back to 2020, STR listings have increased 42% since December of 2020.
Tracking Labor Day Weekend which is showing increases in price when compared to Memorial Day Weekend of on average 2.51%. Will be interesting to see if that holds this week.
Top Cities with Highest % Decrease in Average Daily Rate (ADR) Compared to Memorial Day
Indianapolis -59.58%
Rosemary -48.32%
Ventura -41.66%
Hoboken -25.29%
Bentonville -25.29%
Top Cities with Highest % Decrease in Average Daily Rate Compared to 12-Week Average
Indianapolis -28.35%
Ventura -25.09%
Rosemary -48.32%
Washington DC -20.77%
Pittsburgh -9.89%
Top Cities with Highest % Increase in Average Daily Rate Compared to 12-Week Average
El Cajon 49.62%
Oceanside 37.15%
Carlsbad 35.37%
Seattle 33.55%
San Diego 33.15%
Top Cities with Highest Average Daily Rate - July 2023
Newport Beach $771.53
Westchester $744.91
Rosemary Beach $720.82
Cape May $592.29
Encinitas $576.17
Top Cities with Highest Average Daily Rate - July 2022
Rosemary Beach $799.85
Newport Beach $767.51
Westchester $619.46
Cape May $579.92
Encinitas $570.53
Commercial Real Estate (CRE)
Everyone flees into industrial and calls it safe just in time - right? When I was on the road I cannot tell you how many vacant industrial sites I saw. If only I had a little army that could follow me and capture everything I see.
Absorption nationally is also down 72.13% from the fourth quarter of 2021 when 161.12 million of industrial space was absorbed, a historical high.
Absorption is the occupancy of previously vacant space and is an indicator of renter demand. Indeed, demand for industrial space is softening as high inflation has caused a deceleration in consumer spending, meaning that distributors and manufacturers are experiencing a lesser need for industrial space to store their goods.
Keeping a large inventory of goods, called a safety stock, became more popularized following the coronavirus pandemic, when e-commerce spending was high and supply-chain issues were delaying distributors' and manufacturers' ability to ship products. In fact, it was more cost-effective to keep a large inventory of goods so demand could be met immediately.
Softening Demand
The softening demand has caused construction deliveries to outpace the absorption of industrial space. So far this year, 237.19 million square feet of space has come online, while 116.3 million square feet was absorbed.
As a result, the national vacancy rate grew to 4.1% in the second quarter, from 3.5% in the previous quarter and 3% in the second quarter of last year.
Cushman & Wakefield projects that completions will outpace demand throughout the rest of 2023 and 2024, pushing the national vacancy rate even higher. Vacancy is expected to be more than 5% next year, but that will still be lower than the 15-year historical average of 6.6%.
Industrial Absorption Drops 67.3 Percent from Last Year (trepp.com)
De-NILE ain’t just a river in Egypt.
Keeping this chart here for fun.
In other news last week, Blackstone is raising some cash and selling its 22% stake in the Bellagio. They aren’t always as sharp as you think, but pay attention to what PE is doing. It’s important. And, if you haven’t already, please, please check out this book, Plunder which was written by an attorney at the DOJ…and he still works there (curiouser and curiouser):
Plunder: Private Equity's Plan to Pillage America: Ballou, Brendan
Reference articles:
Industrial Absorption Drops 67.3 Percent from Last Year (trepp.com)
Cannae Advisors, Morgan Stanley Buy $174M Debt Attached to Albany Mall – Commercial Observer
EY: Five Takeaways from a Recent Look at Office Trades - Connect CRE
Blackstone Selling 22% Stake in Bellagio to Cash In on Las Vegas Rebound - WSJ
Landlords With $1.2 Trillion of Debt Face Rising Default Risks - Bloomberg
Office Tenants Are Renewing Leases—but for Far Less Space - WSJ
More articles linked below in the reference section below….
Coming Soon: Whatever I can manage :). It’s been a crazy summer, and I still have to make a living, so I will do my best over the next several weeks as I try to do more local Florida research and keep my finger on the pulse of macro.
Reference
Rent
Last week’s updates included changes in rent metrics from RealPages. As mentioned here previously I have been struck by how little movement there has been using this source, but this month I noticed something interesting. RealPages started including some statistics in its write-up of each city including year-over-year changes in occupancy for all but a few key cities which is telling in and of itself. In case you haven’t seen this, RealPages is currently under investigation by the DOJ.
Average year-over-year decreases in occupancy for the cities I track and the cities that RealPages lists is -1.57%. Some of the key cities that are missing these stats in their write-ups: Chicago, Dallas, Houston, Nashville and Phoenix. Someone has shared a new source with me that I will be looking at next week as well.
Top Cities with Highest % Decrease in Average Rent June to July
Nashville -15.92%
Asheville -13.71%
Coeur d’Alene -11.88%
Destin -10.28%
Chicago -9.68%
Top Cities with Largest Decrease in Occupancy Year-Over-Year
Augusta -3.09%
Tucson -2.44%
Boise -2.30%
Atlanta -2.30%
Indianapolis -2.18%
Notable Mention: Miami - 1.91%
Airbnb/VRBO - Short-Term Rental (STR)
Top Cities for Short-Term Listings July
New York 26,809
Miami 14,502
Las Vegas 13,913
Los Angeles 11,765
Houston 11,588
Austin 10,911
Atlanta 10,879
San Diego 10,746
Orlando 9,763
Sevierville 8,816 (knocking out Nashville from June)
Top Cities with Biggest Increase in Short-Term Rental Listings Jun-July
Fort Myers 14.35%
Indianapolis 6.53%
Las Vegas 6.43%
San Diego 6.24%
Oceanside 5.32%
Top Cities with Biggest Decrease in Short-Term Rental Listings Jun-July
San Jose -6.37%
Phoenix -5.25%
Portsmouth -4.85%
San Ramon -4.30%
Tucson -4.16%
Top Cities with Biggest Increase in Short-Term Rental Listings Jan-July
Destin 37.32%
Coeur d’Alene 36.71%
Cape May 31.94%
San Ramon 28.99%
Palm Springs 22.49%
Top Cities with Biggest Decrease in Short-Term Rental Listings Jan-July
San Jose -21.04%
Dallas -18.02%
New York -13.39%
Fort Myers -11.82%
Houston -8.53%
Top Cities for Short-Term Listings July
New York 26,809
Miami 14,502
Las Vegas 13,913
Los Angeles 11,765
Houston 11,588
Austin 10,911
Atlanta 10,879
San Diego 10,746
Orlando 9,763
Sevierville 8,816 (knocking out Nashville from June)
From Inside Airbnb
As I’ve mentioned previously all data is not equal. Inside Airbnb has incredible data, but it is only for a handful of cities and is published once a quarter. Their listings tend to be much higher than the data provided by AirDNA and others, but they trend in the same direction. In October I will do a deep-dive on the differences and trending so we can see how closely the myriad data sources track. But, for example, Inside Airbnb data shows Nashville with 8,993 listings at the end of June while AirDNA has 8,105.
Only one city in the cities they track- Dallas - showed a decrease in listings from March to June which was likely due to the recent legislation. As the stock market took off so did everyone’s hopes and dreams. Unfortunately, I believe that not only will legislative efforts start to tick up (Airbnb’s lawsuit against NYC was dismissed last week), but the sentiment will likely sour in the next months based on macroeconomic clouds that are gathering.
Historical & Monthly Comparisons
Lowest Occupancy July 2023
Augusta 55.33%
Winter Garden 51.40%
Palm Springs 52.02%
Phoenix 54.68%
Sedona 54.60%
Lowest Occupancy July 2022
Palm Springs 50.45%
Sedona 50.93%
Tucson 52.00%
Phoenix 53.78%
Augusta 55.33%
Highest Occupancy July 2023
Destin 91.44%
Newport Beach 91.21%
Cape May 90.50%
Rosemary Beach 88.91%
Oceanside 88.87%
Highest Occupancy July 2022
Cape May 93.39%
Rosemary Beach 89.34%
Destin 88.97%
Westchester 87.17%
Oceanside 87.17%
Commercial Real Estate
Going to keep this incredible podcast with Jack Farley, John Toohig and Randy Woodward in this section until they do the next one - it’s just that good.

Per John, the only commercial real estate trading at the moment is for Trash and Trophies and despite MSM narratives trouble is on the horizon. Miss this at your own risk.
Loop landlord files for bankruptcy ahead of foreclosure sale | Crain's Chicago Business
Google Looks To Offload Another Big Office Campus in Silicon Valley (costar.com)
WeWork Risk Seen in Commercial Mortgage Bonds, Barclays Says (yahoo.com)
Big Banks Are Trying to Dump Commercial Real Estate Debt As Pressure Mounts (businessinsider.com)
The Commercial Real Estate-Small Bank Nexus | ZeroHedge
Local Malls, Stuck in ‘Death Spiral,’ Plunge in Value - WSJ
Troubles for Wall Street office tower worsen as foreclosure looms (nypost.com)
Understanding the challenges in the U.S. commercial property market
Commercial Property Investors Huge Office Bet is Unraveling In London, New York and Paris
Commercial Real Estate Reset is Causing Distress from Sand Francisco to Hong Kong
CRE’s Strains are contained: But in a recession the dam won’t hold. (contained you say?)
Big commercial real estate downturn could sink 300+ banks: Report | American Banker
Westfield Gives Up Downtown San Francisco Mall (sfstandard.com)
Goldman Sachs CEO Solomon warns of commercial real estate write-downs (cnbc.com)
Hotel Owners Start to Write Off San Francisco as Business Nosedives - WSJ
Sunbelt Construction Boom Threatens Top Apartment-Building Owners - WSJ
US banks prepare for losses in rush for commercial property exit | Financial Times (ft.com)
Interest-Only Loans Helped Commercial Property Boom. Now They’re Coming Due. - WSJ
You are absolutely nailing it. Mike Reynolds Earth Ship architect said: the key to success is wanting what no one wants and not wanting what everyone else does.
It's a cure for lemming-itus.
I knew every street & neighborhood in Seattle before I bought my first house. Natives often remarked "where the hell is that?". I sat with a realtor who said "oh no don't by there" but I already looked at a map, saw ocean & I5 on one side and Lake WA on the other - 20 mile spit of land at best and neighborhoods all around up as much as 36%. $145k in, 4 years later $270k sold.
It was a fantastically (real) diverse ungentrified place. Now? Stepford wives - the kind that all virtue signal diversity until it's bought and gone.
True story (don't have the citation right now);
For men, the same area of the brain lights up for Tools and when they see pictures of women. What I want to know is what similar locations for womens' brains light up?
My point being, without awareness we can be fleeced right out of our life'$ work and savings.
In 2005 the rising $ housing market in pockets around the US became a shell game - it was obvious! I bought a SFH for long term rental and in 8 months was outvoted by the realtor & bizz partner - no sell now! Had to restage it to reflect that and 4 days later sight unseen a woman from Coral Beach Fla. Bought it (for way too much).
That's when I knew we were screwed as a nation. That duck duck goose ended with the GFC.
After 20 years of this I'm STILL not experiencing one single person making the basic connection between higher housing $ and higher Taxes. It's a simple single line from one to the other.
Honestly at this point all I can say is most buyers suffer from "it'll never happen to me syndrome" and those who seek to benefit from another's stupid decision are all to happy to pick their mark up at the airport, drive the nicest roads and wine & dine them.
And yet those angry men with the car, the boat, and the european-style largese is still winning young trophy wives, whereas the industrious twenty-something yo's frugally but stably building actual assets doesn't get any attention from the opposite gender. Moral hazard doesn't just have financial consequences - it corrupts social values too.