
Trouble in the Triangle

I absolutely love learning. If I am not learning I am not happy. This is why I often find myself at the end of the road of one challenge looking for the next. What I love about learning most (while also hating it) is how you start the journey as if in a fog, drinking water from a fire hose. That feeling can be one of the most overwhelming and disorienting feelings humans experience. It’s the “freeze” that occurs before fight, flight or fawn where your instincts drown out reasoning. For some, that feeling alone keeps them from foraying into new territory, especially if they had impatient parents or teachers who stung or humiliated them as they were learning to learn.
But, if you can withstand those first moments of humiliation and terror, you will find small islands of comfort and little by little, you will feel the ground beneath you start to firm as you gain confidence through the repetition of knowledge consumption. One of my favorite phrases of all time captures this perfectly: Повторение мать учения, or repetition is the mother of learning.
And, once you find your confidence you are free to go diving far deeper into the intricacies and nuances of your chosen topic as you uncover missed understanding that occurred while you were drinking from the fire hose. Once you reach this stage you can again feel like a total moron, but also achieve a far greater knowledge which brings me to a discussion of home prices. Case Shiller came out last week as I was navigating a family move that involved multiple households and I had little time until now to digest the news. So, what did the media have to say about the data release?
Are home prices rising or falling? According to the seasonally adjusted Case Shiller Home Price Index, home prices rose, but the non-seasonally adjusted data shows a different picture. Additionally, Case Shiller is one index as we’ve discussed which only tracks existing homes (not new) and is a repeat sales index that uses quite a bit of data manipulation such as excluding “data related to homes that sell more than once within six months.” Additionally, the data is very delayed. We received December data on February 27th. If that’s not bad enough, the index uses a three-month moving average which includes sales from October, November and December. And, on top of that, many of our more populated counties (heavily weighted in this series) have serious recording delays - sometimes up to a year - meaning that the first look is likely missing key data.
I remember during the GFC reading every single article published about the housing market and feeling more educated than most, including my superiors. But, what I didn’t have time to do as I was updating excel models for strategic alternatives or coordinating due diligence for our distressed asset sales, was to dig into these various indices and data points for true understanding. So, although I would search for the alternative narrative, I did not have a firm grasp of how the data was compiled. So, when Mr. Yun or Mr. Zandi said something that did not sit well I could not confidently explain how they were obfuscating. I formed a deep mistrust for these industry “experts” as they were proven wrong time-and-time again. I honestly believed at the time they just missed the brewing distress due to whatever blah, blah, blah excuse they gave. I now understand it’s much worse than that as I read what they write with a clearer lens. And, I’m truly bothered. I think about how many of us laid our hopes on their advice and rode it to our Earnings calls, embedded it into our internal models and risk assessments. A recent quote from Mr. Yun about demand in Florida really stoked my ire.
But, I digress. One aggregate data point will never, never, never show you the full picture of anything, much less our complicated, tracked housing market which transacts according to the laws of 50 states and local rules of over 3,000 counties. This is especially true with the amount of shenanigans that occur with surveys, seasonal adjustments and data manipulation. I do still largely assume positive intent with these data aggregators, but data is hard, especially when assumptions are not constantly challenged. Data science is an underappreciated discipline that - like most else in our institutions - is, I fear, withering on the vine. I personally try to track numerous data points (about 100) for 80 cities to triangulate and bring you an informed, contextualized perspective at both the micro and macro level. So, this week I wanted to lay some of that data side-by-side, all of which is not seasonally adjusted, so you can see where we have been for the past 16 months.
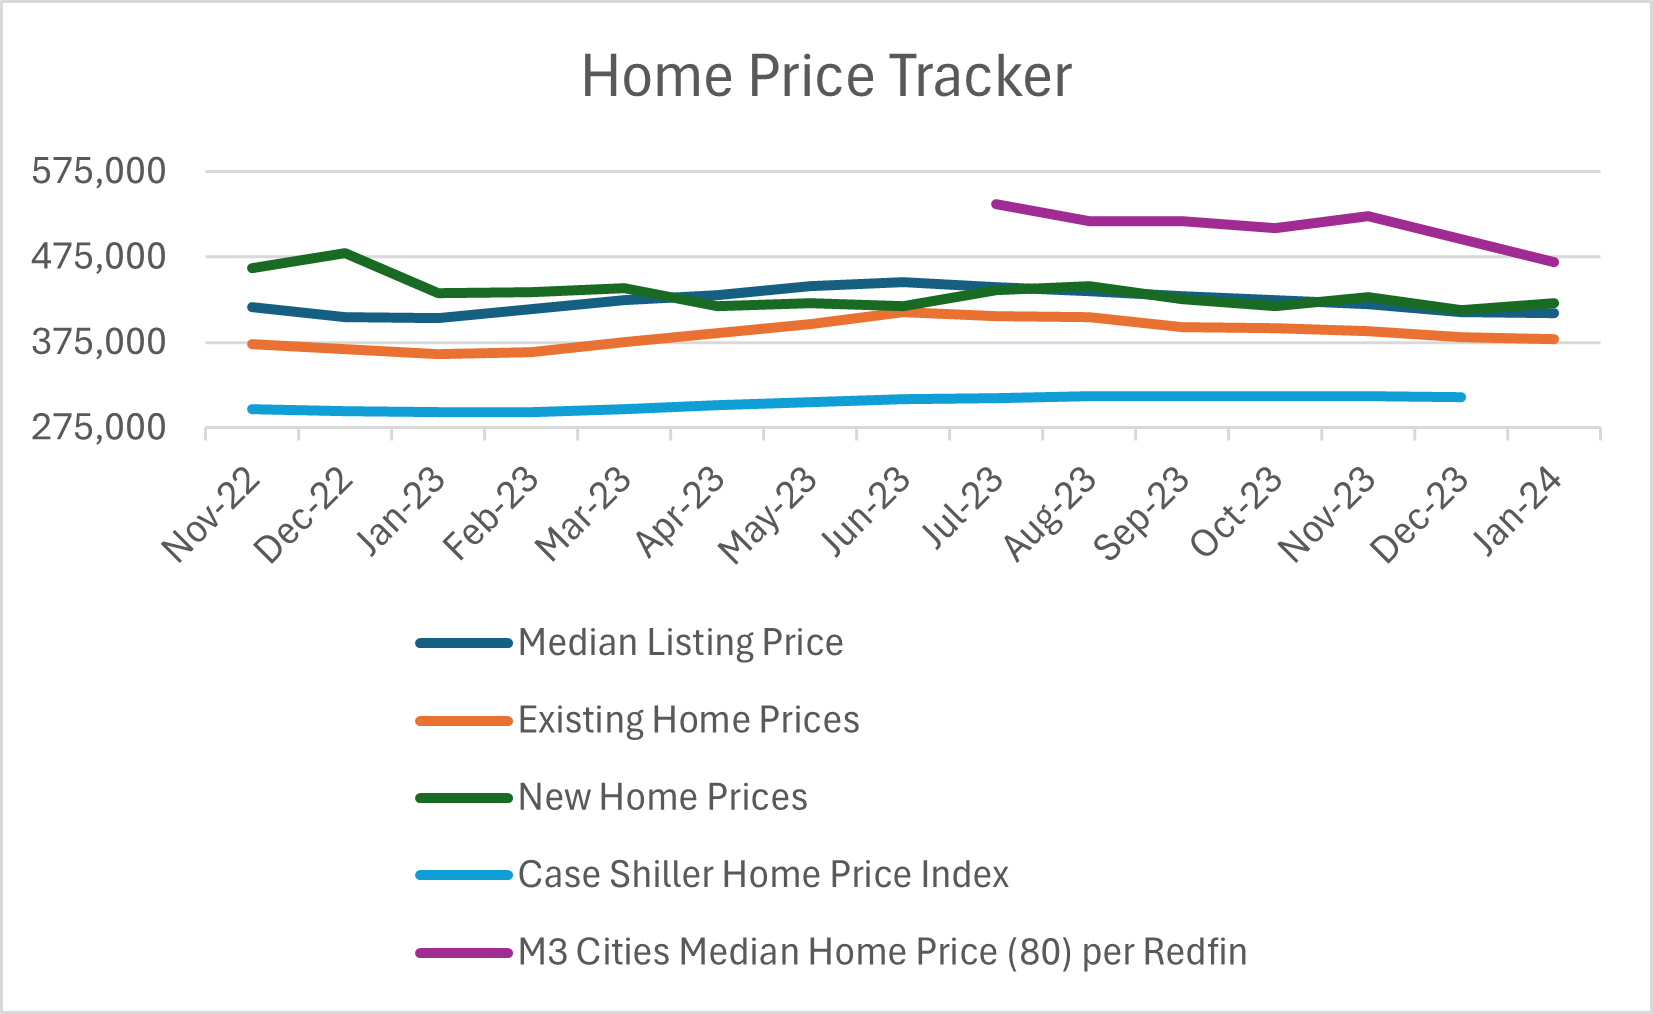
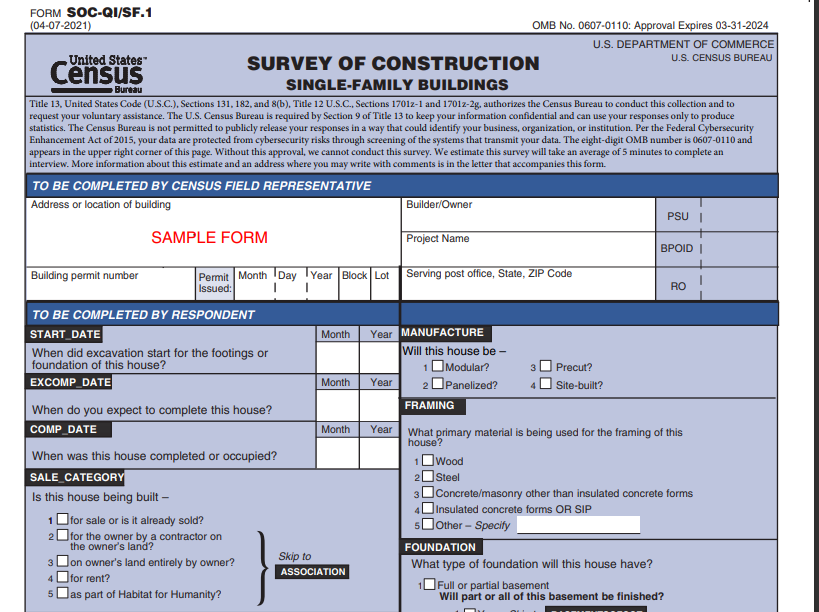
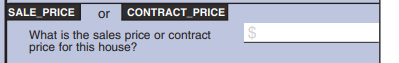
I only started tracking Redfin home prices in June for my cities, but this view I think is informative. Starting in July both median listing price and existing home prices started trending negatively, while Case Shiller started that trend just in November (Sept, Oct, Nov). For the 80 cities I track, Redfin data shows that like Case Shiller, home prices started to trend down again in November. Redfin, unlike many of its competitors, does use some county data like Case Shiller which may be why those two show the trend starting in November. The National Association of Relators (NAR) provides the information for FRED tracking of existing home prices and the median listing price, using MLS data. For new-home prices, the Census Bureau uses a Survey to the builders to track initial home prices which is typically not the price post concessions, but what is placed in the initial sales contract (h/t Mr. Awsumb, for the link to the form).
Of the five series pictured above, only new-home prices had a slight tick-up for the latest set of data. Based on the number of sales and their distribution (66% under $500K and 46% under $400K), I believe this will likely be revised away or we will see a reversal in the next month or so. Despite media hype showing the opposite, gravity is finally starting to take hold. Will gravity meet resistance in the form of Nvidia mania (Friday’s minor correction aside) and election-inspired tax credits for first-time homebuyers and starter home sellers as announced by Biden in his State of the Union address?
Before answering - a quick, illustrative aside: when linking the article about Biden’s announcement, I realized that CBS quoted home prices from the new residential sales series instead of Case Shiller. Though I don’t know, there is a possibility the background info was also provided in a press pack and chosen because it shows a 27% increase in home prices versus the 45% increase seen in the Case Shiller index. Another possibility is AI or a frazzled intern picked this series based on its title not realizing it is part of the new home sales series. See what I mean? None of this is easy.
As discussed in my last Substack, I do not believe Nvidia mania can materially change our course. But, what of these announced Biden initiatives? Let’s dive in for a moment before moving on to my macro-micro, Raleigh report.
Keep reading with a 7-day free trial
Subscribe to M3_Melody Substack to keep reading this post and get 7 days of free access to the full post archives.