
Under the Covers

We are twenty days into 2026, and the ride has already been wild. Proclamations from the administration come fast and furious with scarce opportunity to consider implications of proposed measures which may or may not come to fruition. With each passing month, though, as I spend hours in the details, I learn more and more about the nature of the housing market and the data that we digest, identifying patterns that are largely missed by those that focus only on the latest aggregate statistics. I question prior assumptions and test out new theories, learning from my previous mistakes.
The information thus far published in December is full of clues about what we can expect in 2026, and the path housing will take. So far this month we have received December Existing Home Sales and New Home Sales data for September and October. Although we are still missing two months of new home sales data, it’s safe to say that 2025, from a combined sales (new + existing) perspective, will likely be lower than any year besides 2008, 2009, 2010 and 2011.
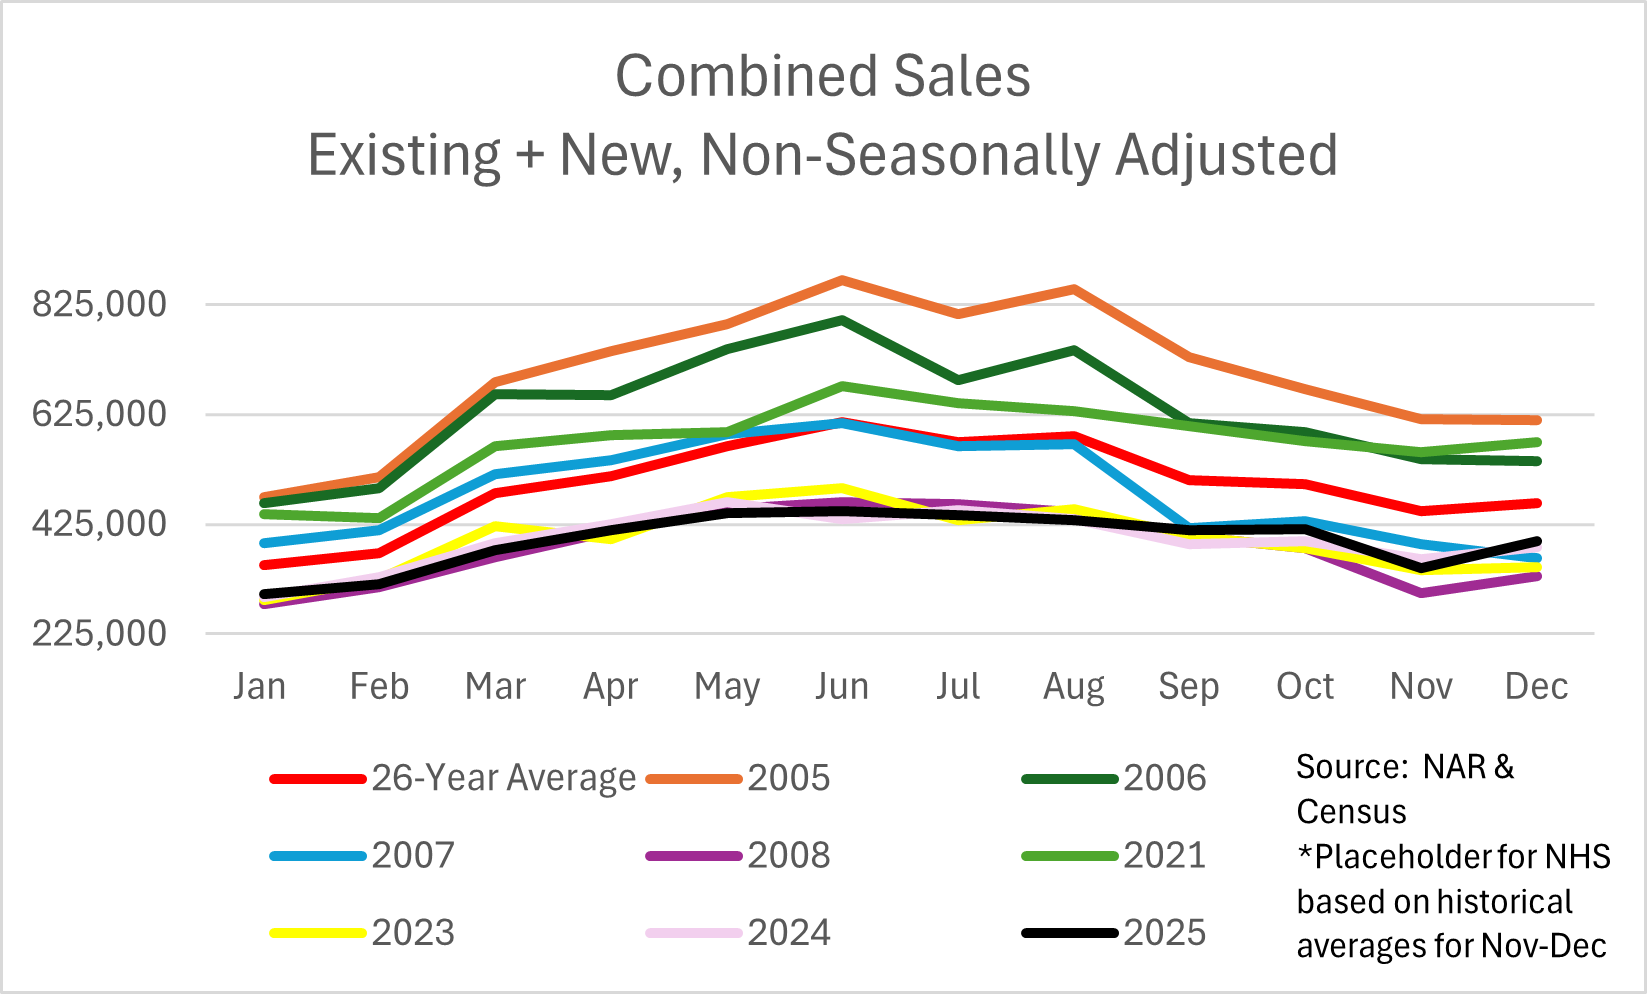
The yearly average for combined sales since 1999 is 5.9M. Using historical averages for new home sales, I’m estimating 4.7M combined sales in 2025, which will be the worst of this cycle. For comparison, sales averaged 4.6M from 2008-2011. Since 2008, we have increased population by 12.32%. At the same time, we’ve seen the median sales price, according to the National Association of Realtors (NAR), continue to increase, albeit at a decelerating pace. While we saw significant YOY deceleration during the Spring selling season last year, existing home sales prices over the late summer and fall wobbled back and forth…that is until December.
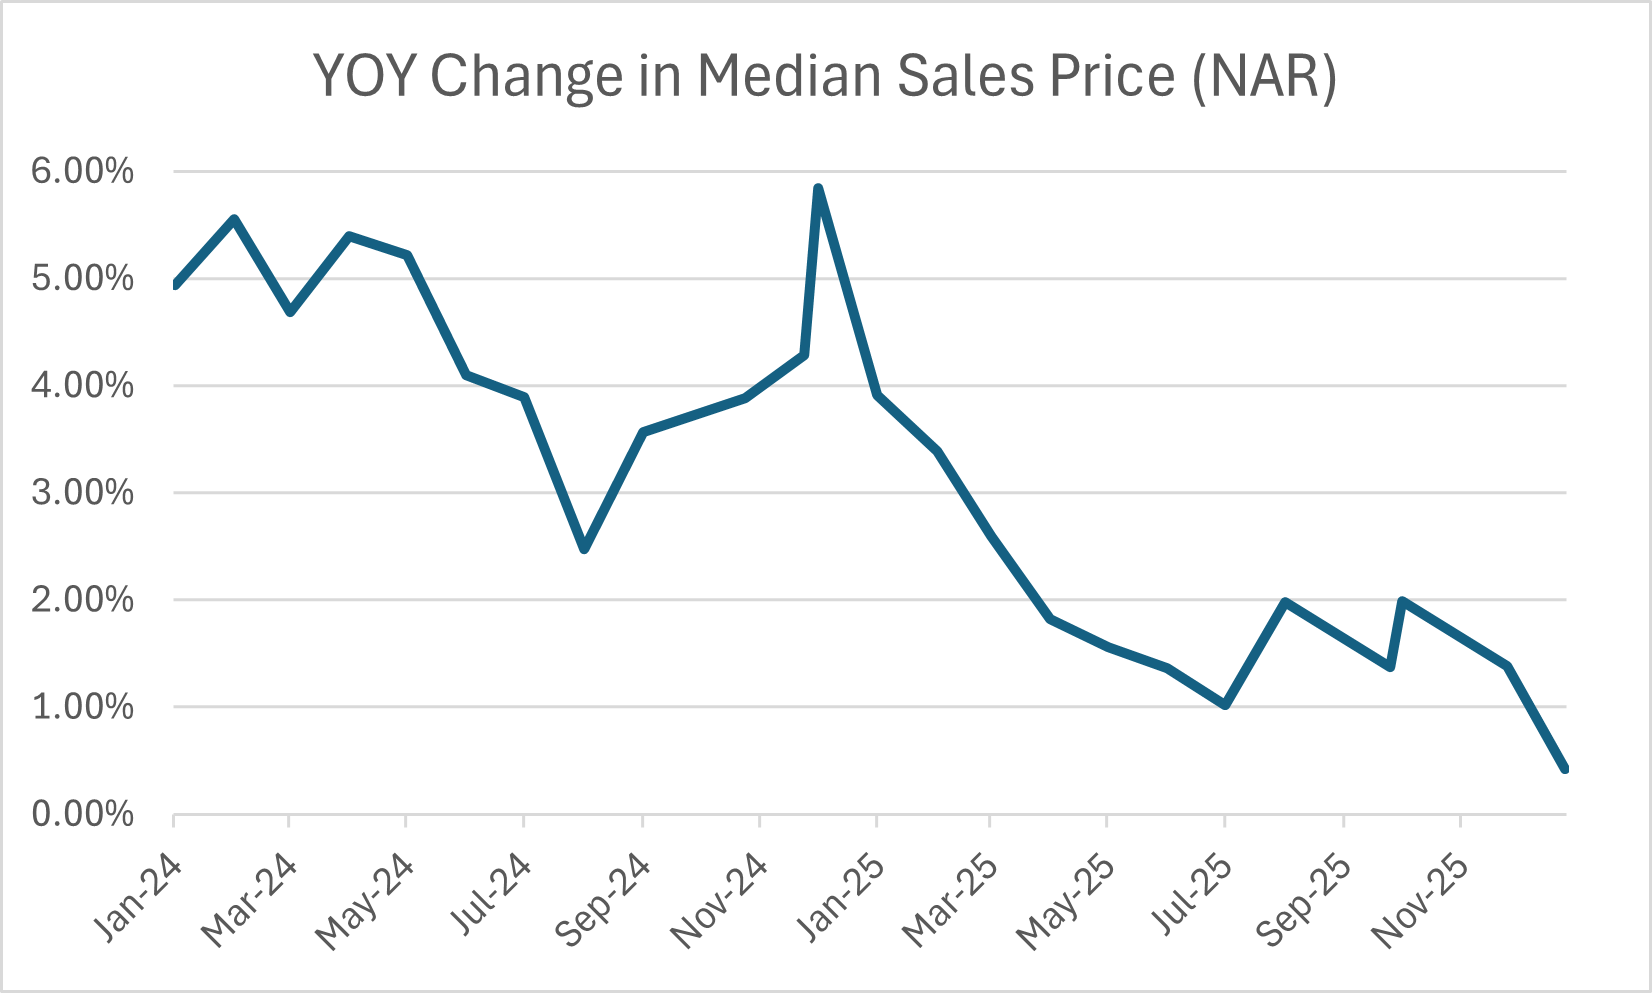
The 0.42% YOY increase in the median sales price reported in December is markedly lower than the 5.85% YOY increase we saw in December of 2024.
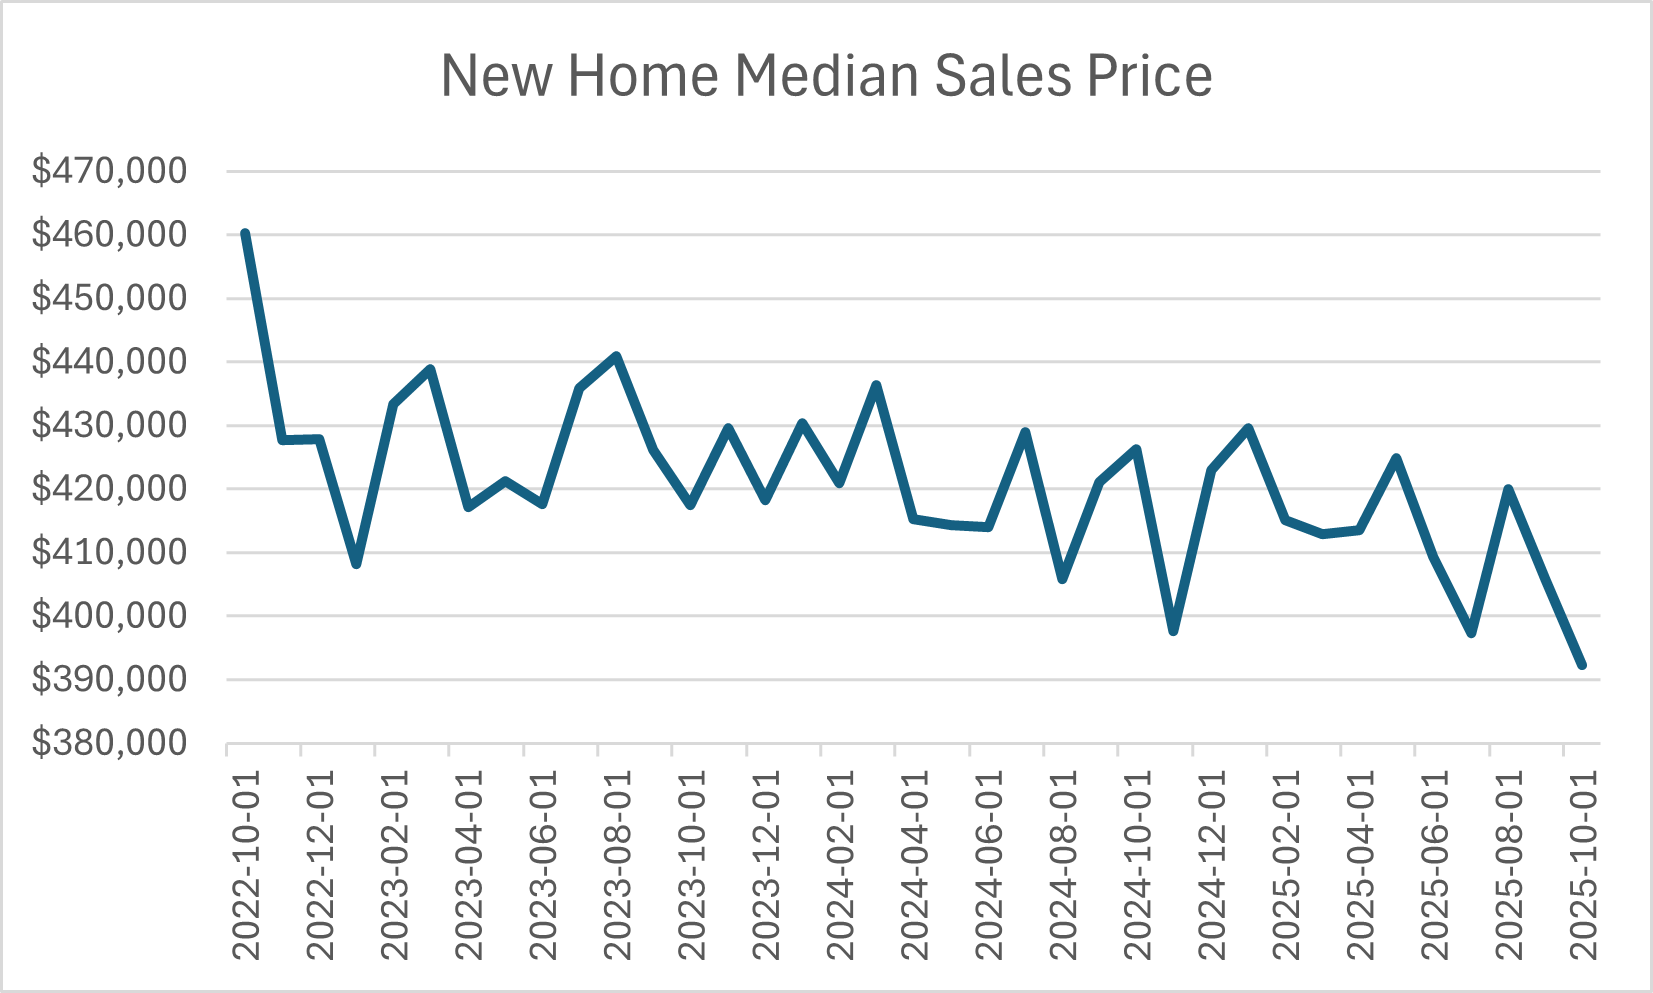
New Home median sales prices on the other hand are already down -14.77% from their 2022 (revised) peak.
Where will we go from here? The answer lies in the details I painstakingly review each month. Below we will review regional market metrics for both new and existing sales such as sales, prices, days on market (DOM) and inventory. You will not believe which region just went YOY negative for median sales price in the M3 series. This is a significant reversal that means that next month we may no longer be simply talking about regional declines. September and October results for the builders are telling an important tale, while yet another series that I follow closely provides further evidence a YOY decline in the NAR series is just around the corner. Also, guess which October had the exact number of new home sales as 2025? For the data curious, I will share below.
As I often say, we have to triangulate the data to understand the whole picture versus the prime-time talking points we hear in financial media. FHA delinquency for December is in, and the story there is certainly getting interesting as we knew it would. Finally, I will share my thoughts on the 401(K) chatter we are hearing from the administration and what impact that might have on all things housing.
Let’s discuss what lies beneath these headline results…
