
What is it Good For?

It ain't nothing but a heart-breaker
(War) It's got one friend that's The Undertaker
Oh, war, has shattered many a young man's dreams
Made him disabled, bitter and mean
Life is much too short and precious
To spend fighting wars each day
War can't give life
It can only take it away, oh
Edwin Starr, 1970
Pre-spring chaos has arrived with a roar and a’ rumble as the Ides of March near. Just when you think your ability to be shocked is waning, yet another jolt arrives to bring you off your seat. This is reality in the year of our Lord, 2026. No amount of denial and distraction can change the facts we do know. What do we know?

The Strait of Hormuz is effectively closed, and bombs are being dropped all over the place. Iran recently clarified that friends will be allowed to pass, but the risks remain. If you are unfamiliar with the fog of war concept I encourage you to familiarize yourself with it because it is a thing-thing. A poignant depiction of the fog and fervent chaos during Vietnam can be found in Michael Herr’s book, Dispatches. I believe this is where I first learned about American Psyops after having studied the Soviet propaganda machine in undergraduate studies. What does war have to do with the economy and housing? Well, lots. We won’t be able to cover all of it today but at a minimum gas prices have already jumped higher.
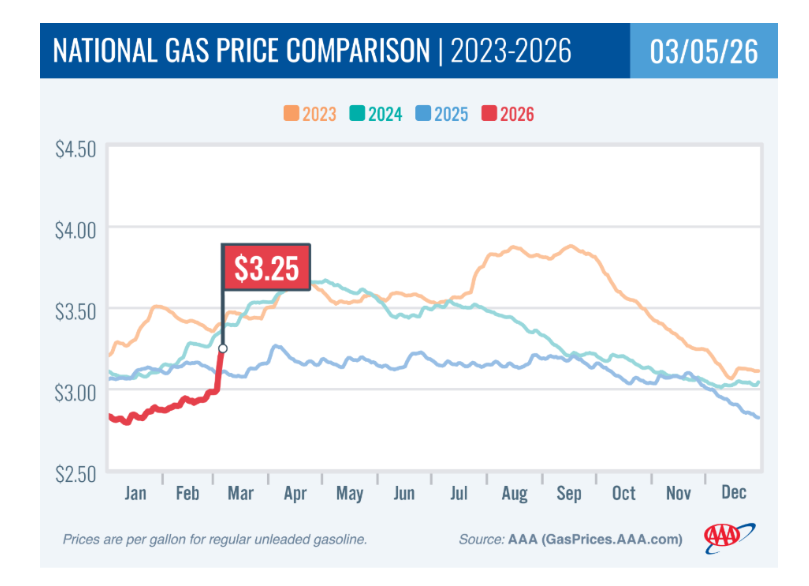
According to AAA, gas prices have risen on average by 27 cents across the country. In East TN that number is 40 Cents. There is much debate about whether the administration foresaw this downstream implication, but I can’t imagine that deep within the bowels of the military industrial complex they were completely oblivious to this potential outcome. Again, the outcome is more important at this moment than the rabbit hole. If you don’t remember 2022 when gas prices rose due to the Ukraine/Russia conflict, let me remind you. I personally witnessed several meltdowns at gas stations where people were downright hysterical. You could feel the desperation. The only wiggle room the bottom and middle of the K have had has been lower gas prices. With that ever-so-scarce wiggle room evaporating, get ready for our economic metrics to get worse:

The biggest loser for retail sales outside of spending at department stores (-9.8%)? Spending at Furniture and Home Furniture Stores at -3.5%. You know what isn’t decreasing when the housing market is hot? Spending at furniture stores.
War is not only a problem for gas prices. It is a big ol’ problem for mortgage rates. Just when we thought the Spring would get a boost with rates under 6.00% Big Daddy War came in and squashed the industry’s dreams. There were lots of folks calling for the 10-year to fall and with it mortgage rates, but that was not the highest probability in my view. When the U.S. decided to seize Russian assets due to its conflict with Ukraine, long-term U.S. debt buyers were forced to think twice about those purchases even if they needed some portion of those assets to play in the global monetary system. Secondly, I remember what happened in the months after that conflict started.
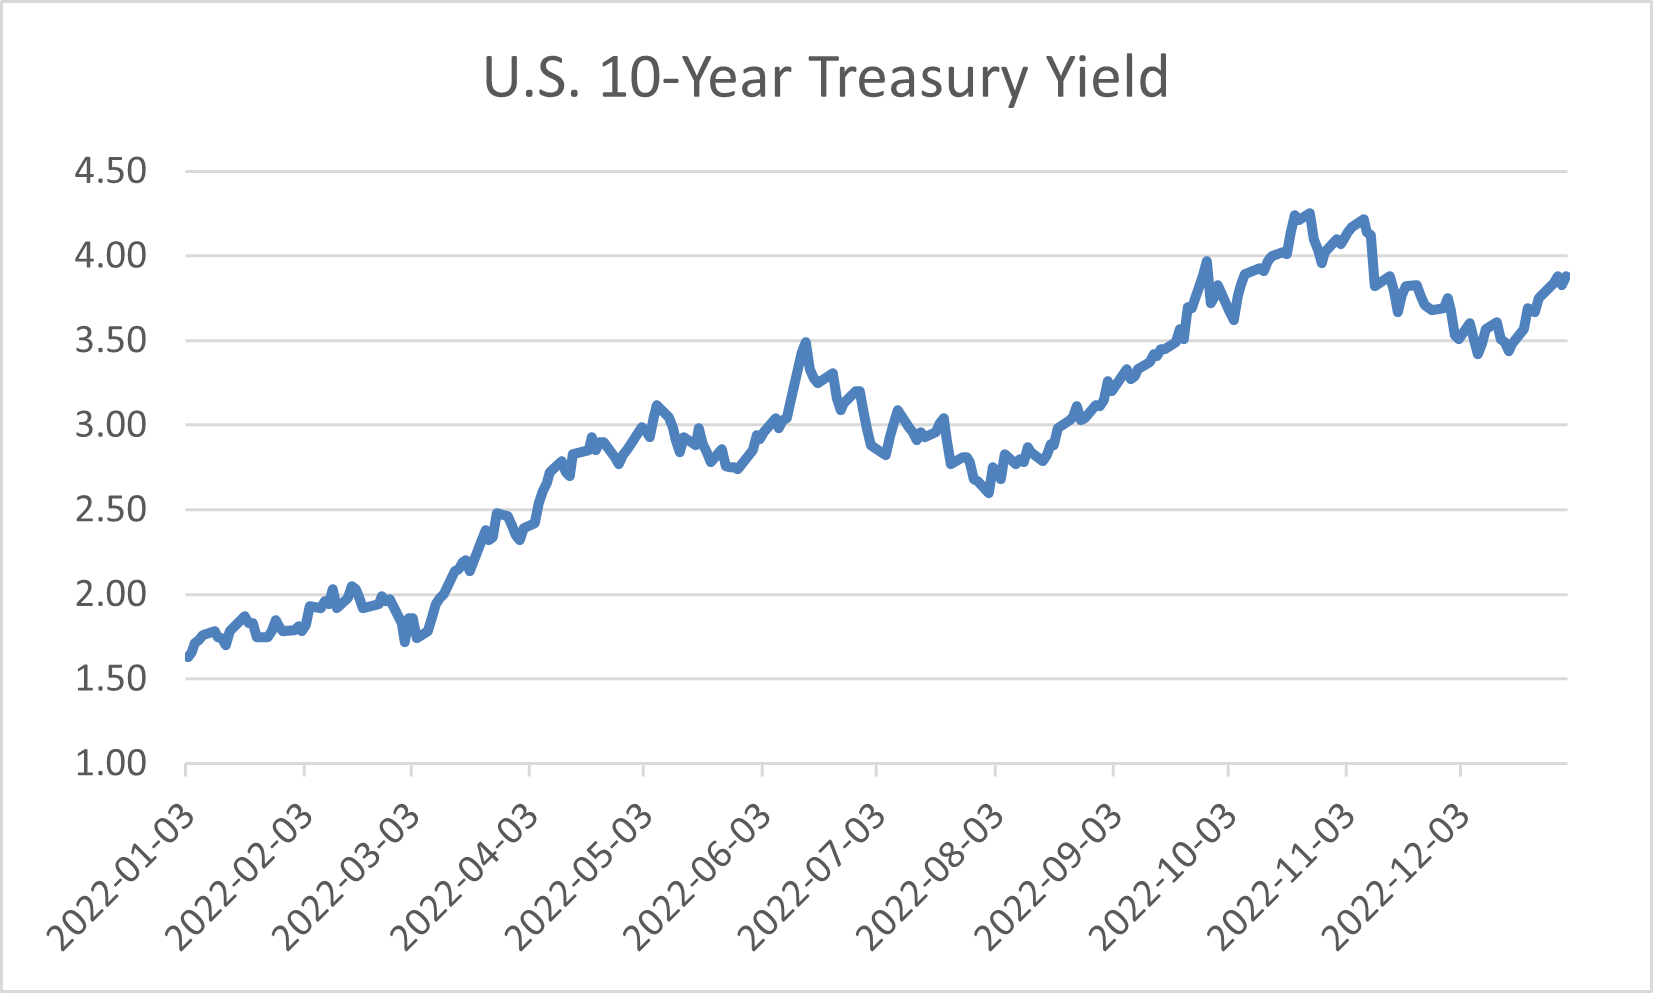
The conflict started on February 24, 2022. Although the 10-year moved down slightly in the first few days, the yield then marched steadily higher. By the time the Fed raised rates in March, the 10-year treasury yield was already over the 2-handle. On May 5, 2022, yields breached 3.0% for the first time since November 2018.
On April 24, 2024, President Biden signed into law H.R. 815, a consolidated $95.2 billion supplemental appropriations package providing security assistance and foreign aid to Ukraine, Israel, and the Indo-Pacific region. In addition to appropriations, this legislation includes provisions that permit the federal government to use seized Russian sovereign assets to support humanitarian causes in Ukraine.
There are lots of feelings about the Fed and the bond market. There are also lots of feelings about whether or not China is “really” selling U.S. debt or just rerouting purchases through the Cayman Islands. Again, the “what” and “why” are a bit hazy, like everything else, but the result is clear: the 10-year treasury went back over 4.00% on March 2nd and mortgage rates went from 5.98% on 2/26/26 to 6.14% as of this writing.
Something I’ve learned over the past several years is to not stay wedded to any narrative. Instead, be open to what the data we do have is telling you. The real story will take many years to fully flush out due to lagging data. Look at all sides of the arguments and be ready to pivot as soon as the triangulated data starts telling you something else. I recommend considering this approach. Being flexible in times like this will mean that you can seize opportunities versus being stuck in the mud.
In other news yesterday, employment surprised to the downside to the tune of -92K. Guess which category got hit? Healthcare. After an outsized increase in January, “health care employment declined by 28,000 in February.” The BLS is blaming this reduction in healthcare on the nurses’ strikes in New York. Regardless, other sectors don’t look so hot either.

Take a look at construction above which shed jobs in February. Here’s another view of the YoY change in construction employment courtesy of Ulysses Awsumb:
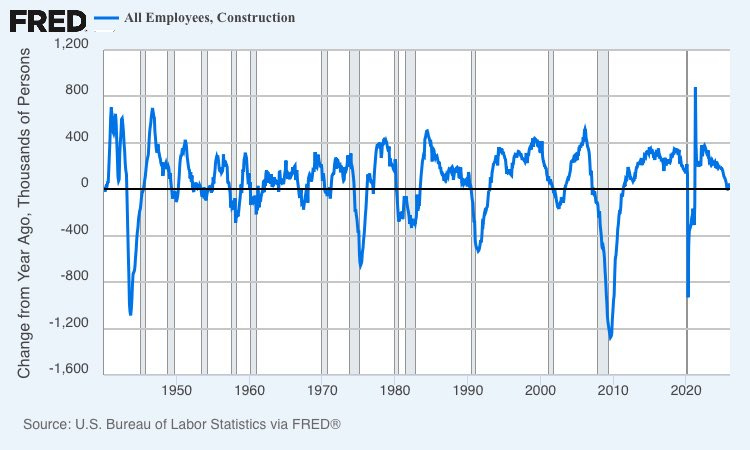
Lots and lots of folks look at construction employment as THE SIGN that the business cycle is turning. Although construction employment is still slightly YoY positive (+0.51%), the deceleration in growth is clear and at levels we’ve seen just prior to previous recessions.
According to Challenger, layoffs in February were not nearly as brutal as January (48,307 down from 108,435) but plans to hire YTD are down significantly: “so far this year, employers have announced plans to hire 18,061, down 56% from 40,669 new hires during the same period in 2025.”

Looking at the January-February YTD totals in the above chart shows that since 2023 we have been trending higher than every year since 2009.
So, everything is splendid, right? Before getting to today’s meat and potatoes let’s make a little stop to check in on Private Credit. Suffice it to say, I’m starting a tracker as I can’t keep up with the accelerating implosions in that sector. If anyone has time to spare, I recommend going through Blue Owl’s list of investments for kicks. I could be wrong of course, but I believe Blue Owl will be a name that will be writ large in history books…one of many, but prominently featured, nonetheless. There are many juicy private credit headlines to choose from including BlackRock’s announcement yesterday that they are gating withdrawals.

The firm’s $26 billion HPS Corporate Lending Fund, one of the industry’s largest non-traded business development companies, said in a statement Friday that shareholders requested 9.3% of their shares, but management decided to cap the repurchases at 5%.
I bet BlackRock is regretting its purchase of HPS which closed in July of 2025. In fact, it reminds me of how Cerberus felt around December 2006 about its purchase of my former company, GMAC ResCap.
Looking at mortgage specifically, last week we found that double pledging didn’t just happen in the auto sector. To remind everyone, double pledging happens when you pledge the same asset to multiple borrowing facilities. Let’s say I have a warehouse line at both Citi and Chase where I pledge assets, and they give me cash. When trouble comes to town someone will get left in the cold if one asset is pledged in two places. This is a great example of the bezzle I often reference (side note: bizarrely this paper by Michael Pettis has been removed from the Carnegie website). The recent failure of Market Financial Solutions (MFS) in the UK, a mortgage company providing short-term financing on property deals, dinged big names such as Apollo, Barclays, Jefferies and Castlelake. Remember Jefferies got beat up pretty good in the First Brands debacle as well. Western Alliance’s announcement yesterday that they charged off a $126M loan due linked to First Brands kicked their stock price to the curb. They also announced they are suing Jefferies.
Is your head spinning? The private credit headlines are coming just so fast and furious now. The Wall Street Journal published an article yesterday stating that MFS was the latest black eye for private credit:

It was the latest when the WSJ hit publish anyway. Never fear. I’m working on a tracker and tentacle pictograph.
Phew. Who’s ready for the Spring Selling Season? I will tell you who is ready: sellers. This we can surmise because as mentioned here previously listings for sale are exploding. Realtor just confirmed what I’ve been talking about for three weeks.

Most analysts look at the data monthly. I’m old school and watch my 85 markets weekly which is why I could tell you before everyone else what was happening. If you recall, I thought perhaps the crypto rout or wobbliness in the stock market was the trigger. We can’t know for sure but in San Jose specifically, which increased listings by sale by 22.98% MoM for the week ending 3/1, layoffs at eBay and Western Digital could be the culprit. By the by, San Jose also came in as #1 for decrease in YoY sales prices (-10.68%) in January for markets with over 500K in population.
And what of the storm-struck Northeast? They also have now seen listings increase, up 7.16% MoM and 2.21% WoW. For perspective, listings for sale typically bottom in February. On average since 2017, sales decrease -3.11% from January to February with a modest increase of 1.11% from February to March. Typically, by this point in the month FRED publishes Realtor.com data for listings for sale. Oddly, the next scheduled release date for this series is April 2nd. Hmmm.

We know Realtor has the data because they wrote about it. Guess what else won’t be updated until April 2nd? The median list price, which went under $400K in December for the first time since 2022 and has been YoY negative since November. The data providers can pull whatever tricks they want but you will be able to see it in your market either by looking around when driving or by checking the listing sites each week.
In today’s post I will review the Top 5/Bottom 5 market summaries for sales, price, days on market and inventory for the markets I track. Much can be gleaned by looking at who is consistently showing up in the top and bottom 5. Additionally, I will share lists of cities where we are seeing motivated, distressed and depressed selling. 43 of the 85 markets I track had negative YoY sales prices in January compared to 16 in 2025. Contagion is most certainly spreading. Finally, I will share my deep dive into Reno.
Before we hop over to the main event, a quick announcement. My pal George Noble is giving me 10 free tickets to his upcoming investment conference, scheduled for March 11th. The first 10 folks who purchase an annual subscription to my Substack will receive one complimentary ticket to what will most certainly be an exciting and informative event with actionable intel from well-known portfolio managers, traders, investors and analysts. Each of the 15 presenters will share one, compelling stock idea. For details, check out this link.
Ok - now it’s time for those meat and potatoes…
