
What Sorcery Is This?

As most of us were preparing for a holiday weekend, contemplating firing up the grill, laying by the pool or heading to the beach, the Census bureau released its April new home sales series which included massive revisions for new home prices, going back to 2020. The largest revision was an -11% decrease ($51,000) in December of 2022.

For those of you who don’t follow the housing market religiously this might seem like a nothingburger, but this entirely changes the history of what occurred in this market, including its top which was revised down by -7% or $36,500. Thirty-nine of the last fifty-two months were revised. Thirty-three of those months were revised down for an average amount of -$17,536 and a sum of -$578,700. For the 6 months which were revised to the upside, that average revision was $8,117 and the sum was $48,700. In all, home prices were adjusted on average by -$10,192 for a net sum of -$530,000. They made this announcement with little fanfare and gave no real explanation:
I (as well as others) rail against this series often, especially the home price component because it relies on the builders to fill in this information. There has long been conjecture the builders were not including concessions. And even if they were, we know from FNMA’s study that when reviewing over 7.6 million comparables, appraisers themselves did not properly include concessions to reflect true appraisal value.
Within this appraisal population, appraisers reported seller concessions for 7.6 million comparables. Of great concern, for 58% of these comparables, the appraisers made no adjustment for the concessions. Of course, this tends to inflate the appraisal results and undermines the credibility of the appraiser.
The comparables Fannie Mae reviewed could have been new or existing homes, but here we see the bezzle on full display. What do I mean by the bezzle? I’ve talked about it often here, but think of the story of the JP Morgan “missing” nickel.

Upon closer inspection of the actual bags in the vault, Chase realized they did not have $1.3M in nickel at all. I have heard tales that the Census Bureau used to try and confirm - or “inspect” - these new home prices provided by the builders through county records but due to the difficulty, gave up. How many of the national builders use this information from the Census bureau in their own internal models? How many investors on Wall Street use this information in their models? How many banks use this information when they are deciding on the terms for the large, syndicated lending facilities to the builders? How many of you have one of these new homes in your comparable population? How could artificially inflated appraisals be impacting your zestimate? Each month we hear the media talk about new highs for home prices (see below Case Shiller discussion). Each source they tout has its own data limitations so this is why we must be suspect and understand what the series they reference actually tracks as well as triangulate from other sources.
Speaking of appraisers and over-valued appraisals:

I am seeing increased repurchase requests from the agencies to the lenders for loans with questionable appraisals. We will hear more and more of this which I will discuss in a later post.
But, back to the task at hand - what does the new home construction series actually represent, no matter how well intended? What the builders, the banks/money lenders and perhaps administration want you to see. In the early days of 2021, you heard stories of builders slow-rolling homes so they could demand higher prices. If you understand the leverage game you know that the higher price gets more $$$$ when the builders go to the till. No one - absolutely no one in this game has your best interest at heart. Whether you be investor, potential homebuyer, parent of children you want to help find and buy a home, second-home seller, none of these players are on your side. When the bean counters at the federal government can revise four years of history at the stroke of a pen, hoping you won’t notice, it’s probably time to start pulling our collective heads out of the sand. Labor data, inflation data, durable goods data, housing data…..
Something’s happening here….what it is aint’ exactly clear
Buffalo Springfield - For What It's Worth 1967 - YouTube
In that vein, I am partnering with two colleagues, Real Estate Mindset and Nobody Special, on a project to bring data, math and perspective to the stories you won’t see anywhere else….a place where we closely inspect the information that we are asked to ingest each day. The three of us each have our own story as to what stokes our passion for this mission, but our collective passion is borne out of experience, empathy for the Forgotten American as well as fear that our country has lost its way. If you get a chance, I hope you check us out on YouTube.
In other news last week, we also received existing home sales and price information. Despite the rollercoaster the media has you losing your stomach on, we are not seeing outsized moves in home prices this month. As I argue in a recent YouTube video, tis the season for housing, and even during the worst years of the GFC we saw sales and prices rise:

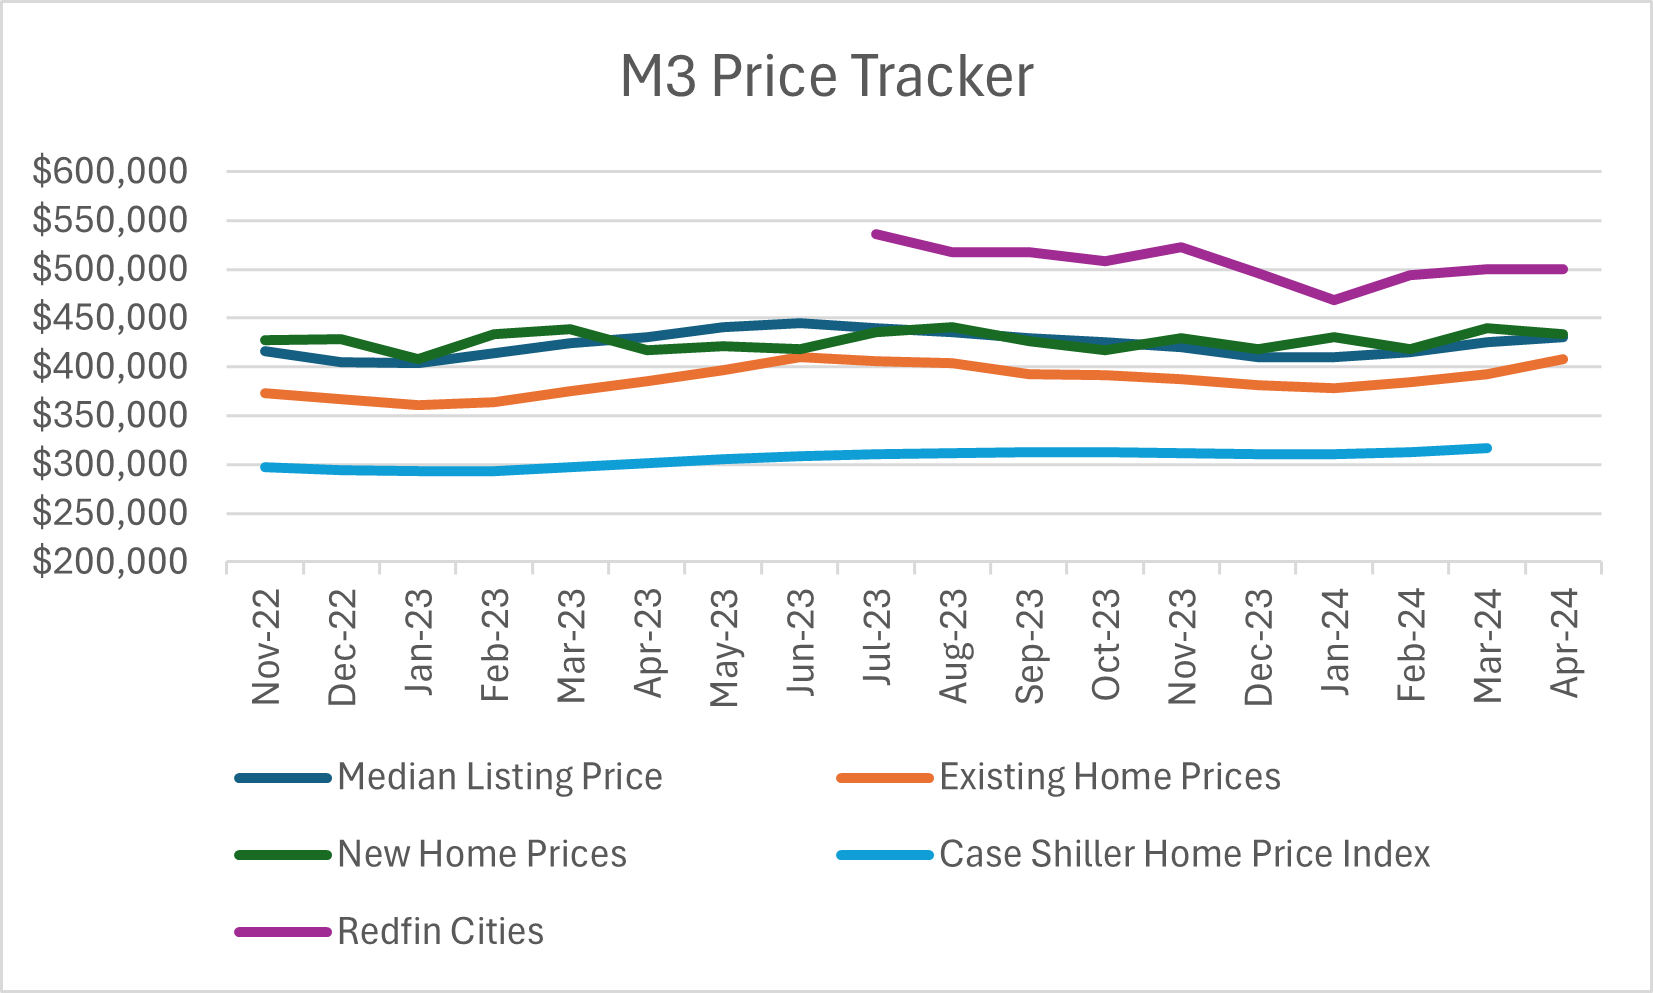
We will likely see swings in home prices during the season, but so far they have not reached their former highs from 2022 (Existing high was $413,800 in June of 2022 and New of $460,300 - revised - in October of 2022). In fact, for M3 cities per Redfin (which includes new and existing), the median price barely moved with a .04% increase MOM. New home sales saw a -1.37% decrease from last month’s upwardly revised number. Existing home sales had the highest increase in prices of 3.74%, but let’s see if that price holds or gets revised away. So far, we have not reached last year’s seasonal high of $410,100 which occurred in June. The 25-year average home price increase from March to April for existing homes is 2.31%, while the last five year’s average is 3.34%. For existing homes, the trajectory historically starts its seasonal decline in home prices in July.
Will existing home prices reach 2022 price levels this season? It’s possible, but per the econometric models and their wonky seasonal adjustments, existing home sales decreased -1.9% MOM and YOY (yes - miraculously the exact same amount). In reality, sales increased 6.82% MOM and 10.77% YOY, non-seasonally adjusted. The 25-year average for increases in sales from March to April is 6.58%, so we are tracking in line with the average. However, what we do know is that the largest percent of increases in homes sold are for higher priced homes:

Homes sold which are priced at $1M+ had the highest percent increase in sales YOY - 39.7%. And before you say that’s because we are all richer, there is much evidence to the contrary. 33.5% of all sales occurred over the $500K mark. Currently our household median income is roughly $80K which means the median household can afford (and I use that term loosely) a $300K home if using a mortgage and a 20% down payment. Individual and institutional investors alike are getting burned by those increased carrying costs due to higher property taxes and insurance.
What of the Case Shiller index and its all-time high published today? Firstly, it’s important to recognize and remember that this series is an index. It does not capture home prices. An index, or
Indices provide both real-time information about the health of financial markets and a regularly updated snapshot of market direction. When equity indices are rising, it's because investors are buying more shares of the indices' component stocks than they're selling, and their prices are going up.
In the case of Case Shiller, this index is anything but real-time. The results we just received for March could include transactions from November (and even further back depending on county delays). Additionally, it measures some, not all transactions in twenty cities. In my view, Case Shiller is just catching up, capturing what was happening at that point in time (several months ago) and around the time of the December “pivot.” We likely won’t start to see this series decline until after the election.
As mentioned above, the new home sales series had quite a surprise for us this month in terms of revisions as well as that MOM drop in new home sales. So, where are we tracking for combined sales? Let’s dig into those new home sales results and look at whether my prediction that 2024 will have a similar trajectory to 2007 for combined sales, is on track. Additionally, I will provide my analysis of Dallas as well as share sales, inventory, price and price-cut data for April for M3 cities including a new summary schedule which shows you markets that are Frozen, Hot or On the Move.
Keep reading with a 7-day free trial
Subscribe to M3_Melody Substack to keep reading this post and get 7 days of free access to the full post archives.