


What's Going Down at Fraggle Rock?

Or in this case, BlackRock? How I actually hate typing that name recalling hundreds of midnight phone calls with screaming baby analysts. No, random analyst assigned to us, we do not have a trading security worth $27 million dollars - that’s the face value. If we did, I wouldn’t have to be talking to the likes of you.
After reading last week’s story about the way in which BlackRock has positioned itself as the government’s (ours and others) asset manager, I have been consumed with memories of the hours lost talking to these black knights who came into my company to help facilitate distressed asset sales and yes (don’t yell at me) feel sorry for some of these institutions who have to deal with them now. Essentially what happens in these situations is that dull knives descend on the company in trouble causing 10x the amount of work had an orderly process been allowed. Just remember for every overpaid fat cat, there are probably 10 completely overworked middle managers holding everything together, not sleeping or eating - people’s names you will never know who make sure that everyone gets paid, the lights stay on and customer needs are met despite the turmoil. Like auditors, these BlackRock “ninjas” don’t really understand your business, nor do they really want to understand. They just need to fill out their checklist….oh - and get paid, a lot.
Why should we care? Well, we need to care because right now those distressed asset sales which include residential, multifamily and commercial real estate for Signature ($27B) and SVB ($87B) are being spun up behind the rock, under the rock, etc. which could likely effect true price discovery igniting the cascade of write-downs we know are coming. If you are in the know and participating in the party, which I assume many are, you have the dish. But, for us general public folk, we are being kept in the dark. The only peep we’ve heard is from a sale of probably one of the best assets they had to sell - a $292 million parcel of agency mortgage-backed securities with coupons of about 2.5% to 3% for which they received 85 to 90 cents on the dollar. Since that story from the first week of the asset sales there has been nary a word about the results that I can find (please send anything I missed). The only thing I can assume is that the rest of the sales didn’t go as well or haven’t gone at all, or we’d be hearing about it. I remember sleeping with my asset sale schedule beside me (not really, but the amount of times I was asked for it on a daily basis by the CEO, CFO, the doozers, etc. meant I kept it VERY close). It changed often depending on who was playing that day, but suffice it to say we weren’t getting 85 cents on the dollar. Yeah - that $27 million dollar trading security was worth zero.
What I know about these in-between times is that the dark forces are never as organized as you think they are. As ummm, complicated as Dimon and his cast of characters are, there is no one completely in control. Believe it or not, she says with sarcasm, sometimes the market has a will of its own. But, this Bloomberg story is important for many reasons because it illustrates how imbricated public and private have become; something I have been thinking a lot about since reading Amity Shlaes’, The Forgotten Man, Russell Napier, Whitney Webb and becoming a fan of Eurodollar University, among others, as well as thinking about the implications of the PPP loans. I posted one quote from the Bloomberg article linked above on Twitter to see what folks thought about it:
"Omarova said the government should consider having an asset-management unit of its own to handle this kind of work."
In fairness, I penned my Twitter post with purposeful vagueness to see if that quote was as intriguing to others as it was me. This quote fascinated me for many reasons, but firstly because I believe in the near future we will see additional government involvement in asset management for distressed commercial and single-family real estate in ways that might shock others. I honestly think Fannie and Freddie will get involved in purchasing and holding assets that were never even backed by their loans (the all-cash home sales from 2020-2023) as well as the orphaned multifamily monstrosities. Secondly, in many ways isn’t that de facto how BlackRock already operates? Additionally, since the 30s no one can argue that housing in particular is not a government sponsored enterprise, becoming even more so after the GFC and COVID. So many questions, but the one that haunts me is - are we deluded about our current state of affairs? Is there really any “critical” distinction between public and private?
I honestly welcome all rants on this topic as my fear is that because we may be deluded about where we are, our solution frameworks could be completely misfiring. How different are these giant, empty commercial and multifamily properties from Evergrande and the Japanese bridges to nowhere?
These themes matter if you are buying a house for your family or as an investment. I mean, do you really want to own a whole passel of Built-to-Rent when you are going to be competing against the government and its affordability mandates? Do you want to buy a home in a new-build site to wake up one day and realize that the rest of the homes have been appropriated by a government agency?
Some of you may feel I’m being a little - insert whatever word here….I’ve been called it all multiple times. But, despite what everyone wants us to believe, things really haven’t gotten better since 2007….for most Americans, they have gotten worse. How much else have we gotten wrong about our current reality?
Enough with the deep thoughts, you say. Fair. For specific updates this week, the main focus will be on listings and some rent action. But, for those of you who don’t understand how much government has changed the housing market, please check out my deep dive into loss mitigation on YouTube as well as this handy chart on the nearly $10 billion in funds distributed to the states already for Homeowners assistance through HAF:

Curious why delinquency rates are so low? This is one of the reasons and many states haven’t even gotten started with only these 4 utilizing over 50% of their funds: Puerto Rico (60.85%), Alaska (57.34%), Kansas (56.57%) and Guam (51.85%). And, they haven’t gotten started because with all the other federal programs they’ve barely needed to use these funds. But, from what I’m seeing in current books that catch-up in the Spring after bonuses and tax refund season has already started to dissipate. So, these funds will likely get used soon which will further cloud our picture of the consumer. And, when these funds run out, there will be more in one way or the other. Unlike many, though, I don’t believe this will stop price declines. But, I could be wrong depending on the type of response we see. Stay tuned.
Without further ado….
Listings for Sale
Top Cities with Largest % Increase in Inventory Week-over-Week (4/30-5/7)
Carlsbad 8.13%
Salt Lake City 5.71%
Nashville 5.41%
Denver 3.59%
Seattle 3.11%
Note: Las Vegas did not increase listings this week, but that huge increase last week persisted (1.7K), less 200 or so.
Top Cities with Largest % Increase in Inventory from Start (1/1/23)
San Ramon 76.67%
San Francisco 73.30%
San Jose 50.14%
Denver 47.03%
Coeur d’Alene 41.71%
Hoboken 39.73%
Boston 38.62%
Austin 37.54%
Rent
These two weeks at the beginning of the month will be when we typically see the most movement in rent. Some of these cities have an interesting dynamic where listings are increasing and apartment vacancy is decreasing. I will be watching this to see if a true correlation exists.
Top Cities with Highest % of Average Rent Price Decreases
Portland -6.23%
Fort Lauderdale/Miami - 5.69%
Asheville -2.12%
Tampa -1.69%
Top Cities with Highest % Decrease in Rent Per Square Foot (RPSF) for Specific New Multifamily Complexes
Encinitas -3.57%
Ft. Myers -3.56%
Asheville -3.20%
Tampa -1.76%
Boise -1.09%
Airbnb
Part of my methodology with Airbnb is to select 2 weeks in the future as I am gathering average prices. For this week that is Memorial Day weekend. Some of these prices are a bit comical, so I will actually track the same week next week to see how they track. This could be fun (yes, I’m a total geek).
Top Cities with Airbnb Average Price Increases Week-Over-Week (4/30-5/7)
Rosemary Beach 57.54%
San Francisco 46.06%
Chicago 33.70%
Boston 33.52%
Cape May 32.33%
Phoenix 31.39%
Top 3 Cities with Airbnb Average Price Decreases Week-Over-Week (4/30-5/7)
Huntsville -8.82%
Salt Lake City -6.12%
Washington DC - 3.36%
Coming Soon: YouTube video later today, Spaces on Wednesday with Amy Nixon (aka TexasRunner) to discuss Airbnb earnings and Bozeman new-build video.
Reference
Airbnb
Inside Airbnb has published its data for March and in many cities there were increases month-over-month for listings after significant decreases the previous month. A good example is Austin which went from 18,337 listings in January to 13,808 listings in February and now up to 14,368 listings. Based on my travels I would say that a good chunk of people still think it’s 2021, especially the fix and flippers who may have been constrained by labor or supply chain issues and are coming late to the party. It will be very interesting to watch this trend for sentiment changes post the mid-March banking crisis and now subsequent credit crunch.
Some stats:
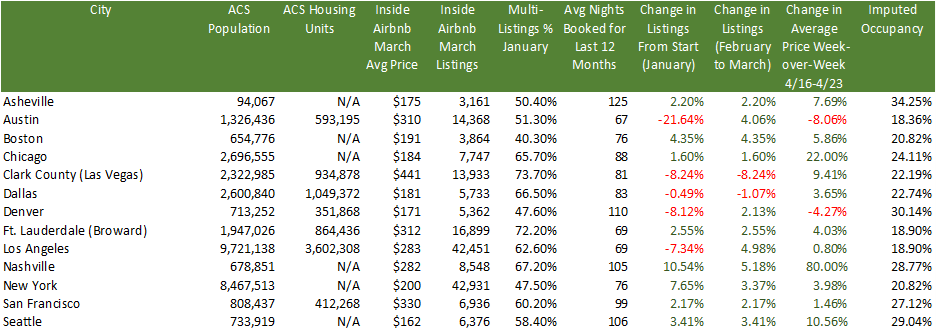
A really interesting stat above is the % of multi-listings per city. This metric represents the % of owners that list multiple properties, not just one. So, in other words, this will give you a flavor to how many investors operate in that market. The average for the cities above for multi-listings is 58.74%. So, despite what Airbnb said on that doozy of an earnings call when no one asked them about their miss in listings projections, their typical client is not someone who is trying to make just a little bit of extra cash. These are investors with multiple properties who are looking for passive income and likely bought these properties with DSCR loans or cash from loans on equity and crypto assets. And, with so many listings the imputed occupancy in these cities is very low and is likely no longer covering debt service cost.
For those who have listened to my Twitter Spaces (check out this one on Airbnb if you haven’t), you know my biggest issue with Airbnb is that besides excursions and nebulous technology improvements, adding listings is Airbnb’s only strategy for growth. I’m pretty sure there is a limit to how many hotel rooms and Airbnb listings we need in each city.
Redfin - Homebuyer Searches
I newly discovered this on Redfin’s website last week. Although searches certainly do not translate into purchases I think it is an interesting metric similar to consumer sentiment. As mentioned above, we need to be looking at more data instead of less, but none of it should be considered in isolation.
Cities with the Highest % of People Searching to Move INTO that City
Los Angeles, Costa Mesa, Newport Beach, Palm Springs 6.0%
Chicago 4.0%
Seattle 4.0%
Cities with the Highest % of People Searching to Move OUT of that City
Tucson 61%
Destin 49%
Huntsville 41%
Asheville 39%
Demographics
The demographic story has been one of the biggest drivers of narratives in the media. Unfortunately, those narratives are conflicting and source-dependent. I’m working on a full post comparing Census, NAR, UHAUL, United and I finally found some cell data so hope to have that finished soon.
ACS Population Change from 4/1/20-7/1/2021
Top 3 Cities with Highest % of Positive Population Change
Ft. Myers +7.9%
Bentonville +4.8%
Coeur d’Alene +2.5%
Top 3 Cities with Highest % of Negative Population Change
San Francisco -6.7%
New York -3.8%
Boston -3.2%
Cities with the Lowest Inflation-Adjusted Median Average Salary
Knoxville $50,245
Augusta $52,286
Johnson City $53,572
Miami $54,273
Tucson $54,498
Ft. Myers $58,607
END