
Charlie Foxtrot
A real SNAFU

Ever since reading Dispatches many years ago, I have had a special affinity for military acronyms and slang. Perhaps I feel like in one way or the other I have spent most of my life in situations where I was called in to triage emergency conditions, assess previous battles, create deployment strategies, deal with combat-weary teams and give hope to the hopeless. The situations are different in detail, but are similar in nature: a real Charlie Foxtrot (aka clusterf*ck) or Situation Normal - All F*cked Up.
When we are in the soup, unable to see, but knowing instinctively that something is not right, hysteria can take hold. The chorus is getting shrill and I can feel the vibrations of the livewire in the distance - people are on edge. Although the media pundits and self-styled savior, Jamie Dimon, are desperately trying to convince us that the worst is behind us, there is a humming that is getting louder and louder for those still in denial about what is happening.
For instance, you can sense the dangerous desperation in the e-mail solicitations and communiques of the DSCR-pushing bezzle buddies who are still partying like it is 2021. Come one, come all and invest in our Built-to-Rent scheme. You will be richer than your wildest dreams. Housing slowdown? Pshaw, we’ve got an exit plan:

Just reading the above makes me wonder if we are yet in the same time zone as clarity? Absolutely, but be ready for some fierce battles over the next several weeks as everyone becomes further entrenched, almost feral. But, no worries, we are building the case block-by-block, not because we want to be right, but because we want to be prepared. And, in that vein, after seeing the latest Black Knight press release on delinquency and working with Clients who have actual books over the last several weeks, I added a new data element this week for Foreclosures from Realtor.com. And, no, not because as some claim on Twitter us “crash dummies” are now moving our eye to default since the magic inventory didn’t appear. The shadow inventory is absolutely starting to appear and by late Q3 I believe no one will be talking about low inventory anymore. But, default has been virtually blasted into non-existence by COVID loss mitigation programs. So, seeing actual foreclosures is kind of a big deal not because a crash is coming tomorrow, but because it signals we are entering a semblance of “normalcy”. As I’ve said before, default became a very different animal after the GFC. With most assets being held on bank balance sheets, the regulations, GSE requirements and guardrails largely focused on that scenario (for a really good refresher course on some of the shenanigans from the last cycle, check out Rudy Havenstein’s recent post). The huge number of all-cash sales means that this default cycle will likely be very different than the last. For instance, the sticker shock on tax bills in TX could mean that some investors walk away. If they paid all-cash, then there is no bank to advance that tax payment. My company lost many, many properties to tax sale in the last crisis. And, we will start to see this happen as bankruptcies continue to increase with filings up 17% year-over-year, etc.
Below, I have posted all cities I’m tracking that had a foreclosure listed, the number, as well as the most expensive home price. I did this because there are some luxury properties in this group and I want to monitor this mix to get a sense of who is most stressed. Some of these numbers shocked me a bit:

Historically, these numbers are very low, but I find the mix in each location very interesting. There is a lot of land and luxury homes telling me this is likely not your average Joe consumer.

At the request of a viewer of my sad little YouTube (will get better), I will be doing a deep-dive on existing loss mitigation programs this weekend. These requirements are important to understand because if you don’t know process you will be confused by the data at every turn.
In other news, I think the “inventory shortage” narrative has topped with Altos and others suddenly announcing inventory has bottomed. Okey doke. Everybody (except for you) is soooooooooo confused by new-builds and current demand. But, most, including the WSJ think this is a rate and inventory story.

No, no, no. Rates are a component, but home-prices will drive this bus forward. As an example, readers and watchers have sent me comments saying that they could stomach the rates, but they wouldn’t be able to afford even a similar house. The reason home prices look like they are staying high is because of all the concessions the builders are doing to keep that top-line price. Additionally, I believe that as fewer homes sell the denominator will dwindle, making home prices look higher, clouding the affordability issue. As I mentioned, we are in the in-between-time. So for many, the only thing that increased home equity is doing is making them feel less destitute. But, soon, as many accept that economic conditions are deteriorating and it’s harder to pay down that credit card balance, they will start looking around and contingency planning…what if I lose my job? what could I sell? that mid-life crisis Harley I bought? boat? car? house?
And, unfortunately, as they start to look around they will see all these articles about supply and price deterioration. Panic will begin - gradually and then all at once - just as the new-builds start to exponentially complete. I’m told the builders usually list just a couple on MLS to drive traffic, but I think they are likely starting to list more to ride this increase in new-build sales. Week-over-week, Las Vegas saw a 21.89% increase in listings with over 1.7K additional properties. What’s going on there? I know they have about 14K Airbnb’s listed in Las Vegas, Clark County, currently. Maybe now that the Taylor Swift amplifier is no more, it’s time to put that house on the block?
In summary, it’s time to practice our combat breathing exercises. The situation we find ourselves in is certainly a Charlie Foxtrot as one reader suggested to me this week, but it has become our situation normal. Although there are many places and people on which we could lay blame, I believe that the answer lies within us. Awareness and assessment first. Battle plans forthcoming.
Now to city-specific updates:
On average this week, we saw an increase of listings for sale of 1.31% week-over-week for all cities tracked and 13.35% from January 1, 2023. For Airbnb, average price went up in the majority of cities. My working hypothesis is similar to what we are seeing in home prices….as the average consumer pulls back, higher-priced listings are a greater number of bookings inflating the average price. No meaningful rent updates this week, so that information will be located in the reference section. Never fear, rent updates should be juicy in the next two weeks after the end-of-month/beg-of-month reshuffle.
Listings for Sale
Top Cities with Largest % Increase in Inventory Week-over-Week (4/23-4/30)
Las Vegas 31.80%
Hoboken 16.85%
Encinitas 6.20% (interesting to see foreclosures here)
Salt Lake City 4.54%
El Cajon 4.18%
Honorable mention: Couer d’Alene - even after that big increase last week, they are up again this week by 2.82%.
Top Cities with Largest % Increase in Inventory from Start (1/1/23)
San Ramon 75.00%
San Francisco 70.25%
San Jose 46.25%
Hoboken 42.47%
Denver 41.94%
Coeur d’Alene 41.71%
Boston 36.33%
Austin 35.23%
Airbnb
As mentioned, Airbnb prices largely rose this week - I believe - due to graduation and wedding season as well as who can actually currently afford to travel. I will mention the top 3 increases and top 3 decreases:
Top 3 cities with Airbnb average price increases week-over-week (4/23-4/30)
Salt Lake City 28.93%
Sedona 22.55%
Huntsville 19.35%
Top 3 cities with Airbnb average price decreases week-over-week (4/23-4/30)
Nashville -48.63%
Miami -15.89%
Costa Mesa - 5.48%
Coming Soon: YouTube video later today, Bozeman new-build video, Spaces on Thursday discussing bank failure asset sales and weekend deep-dive into default.
Reference
Airbnb
Inside Airbnb has published its data for March and in many cities there were increases month-over-month for listings after significant decreases the previous month. A good example is Austin which went from 18,337 listings in January to 13,808 listings in February and now up to 14,368 listings. Based on my travels I would say that a good chunk of people still think it’s 2021, especially the fix and flippers who may have been constrained by labor or supply chain issues and are coming late to the party. It will be very interesting to watch this trend for sentiment changes post the mid-March banking crisis and now subsequent credit crunch.
Some stats:
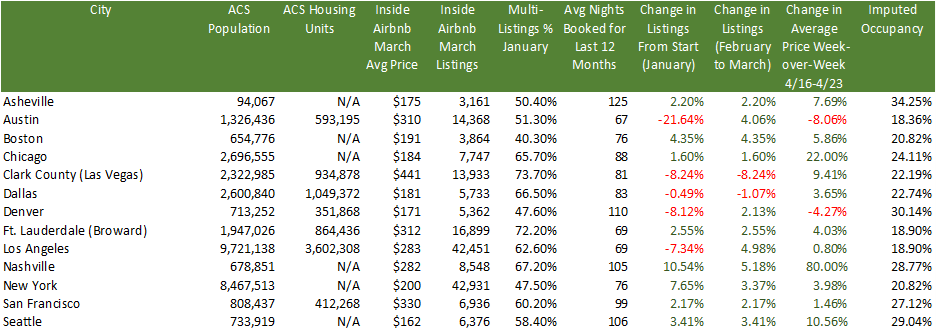
A really interesting stat above is the % of multi-listings per city. This metric represents the % of owners that list multiple properties, not just one. So, in other words, this will give you a flavor to how many investors operate in that market. The average for the cities above for multi-listings is 58.74%. So, despite what Airbnb said on that doozy of an earnings call when no one asked them about their miss in listings projections, their typical client is not someone who is trying to make just a little bit of extra cash. These are investors with multiple properties who are looking for passive income and likely bought these properties with DSCR loans or cash from loans on equity and crypto assets. And, with so many listings the imputed occupancy in these cities is very low and is likely no longer covering debt service cost.
For those who have listened to my Twitter Spaces (check out this one on Airbnb if you haven’t), you know my biggest issue with Airbnb is that besides excursions and nebulous technology improvements, adding listings is Airbnb’s only strategy for growth. I’m pretty sure there is a limit to how many hotel rooms and Airbnb listings we need in each city.
Rent - RealPages updates are live, but typically material changes happen around the second week of the month), so this section remains unchanged this week.
Top Cities with Highest % of Average Rent Price Decreases
Hoboken -34.71%
Asheville -21.23%
Carlsbad -16.53%
Los Angeles -11.58%
Top Cities with Highest % Decrease in Rent Per Square Foot (RPSF) for Specific New Multifamily Complexes
Ft. Myers -20.99%
Pittsburgh -6.94%
Houston -6.9%
Salt Lake City - 6.03%
Redfin - Homebuyer Searches
I newly discovered this on Redfin’s website last week. Although searches certainly do not translate into purchases I think it is an interesting metric similar to consumer sentiment. As mentioned above, we need to be looking at more data instead of less, but none of it should be considered in isolation.
Cities with the Highest % of People Searching to Move INTO that City
Los Angeles, Costa Mesa, Newport Beach, Palm Springs 6.0%
Chicago 4.0%
Seattle 4.0%
Cities with the Highest % of People Searching to Move OUT of that City
Tucson 61%
Destin 49%
Huntsville 41%
Asheville 39%
Demographics
The demographic story has been one of the biggest drivers of narratives in the media. Unfortunately, those narratives are conflicting and source-dependent. I’m working on a full post comparing Census, NAR, UHAUL, United and I finally found some cell data so hope to have that finished soon.
ACS Population Change from 4/1/20-7/1/2021
Top 3 Cities with Highest % of Positive Population Change
Ft. Myers +7.9%
Bentonville +4.8%
Coeur d’Alene +2.5%
Top 3 Cities with Highest % of Negative Population Change
San Francisco -6.7%
New York -3.8%
Boston -3.2%
Cities with the Lowest Inflation-Adjusted Median Average Salary
Knoxville $50,245
Augusta $52,286
Johnson City $53,572
Miami $54,273
Tucson $54,498
Ft. Myers $58,607
END
Very nice. I just read the entire article to my wife as we drive to Cadillac to see our youngest.
“The huge number of all-cash sales means that this default cycle will likely be very different than the last”.
Maybe. You are likely correct. But I’m in the feral camp that a large % of the all cash sales, we’re not actually that. From a real estate transaction basis they looked that way. But the money was borrowed somewhere, against an equity portfolio, vaulted gold, equity in another property, or for institutional investors short term cap ex loans. We shall see how it plays out.
I have about 25% NAV in equities and I have been reducing positions across the board over the last week. Other than my 100% speculations by weeks end my equity exposure will be down to less that half of what it was. I had a great quarter, up until the last couple weeks and that was enough for me.