


End of an Era?

I must admit the fix and flip arc was something I largely missed as I had disconnected from cable TV, choosing instead to disappear into elaborate and character-rich HBO series that reminded me not at all about the GFC, the destruction of wealth, the theft of nights, weekends and time with family and friends. I would get glimpses if I was in a salon or other waiting area where one show or another would forever be playing on HGTV. I, like everyone else who in those instances were captive audiences, could not help but be drawn in to watch a cruddy house turn into something beautiful, something you would be proud of if your neighbors happened by on their nightly walk. And the shows that focused on helping struggling families got to me every time.
How could I forget the countless hours I spent as a child walking home through the new subdivision called Greenbrook, gazing upon the brick houses wishing more than anything that is where I lived, next to all of my friends from school, imagining the perfect lives being led behind those respectable shutters. Instead, we lived in various single-family rentals in not-so desirable neighborhoods, where someone always seemed to be yelling…a source of silly childhood shame. I of course later learned that no matter how tidy those lawns are, there is just as likely to be strife and struggle.
Inventory is rising, a fix and flipper is retiring and a new show is debuting, signaling perhaps a real cultural shift as those who sought to become landlords, to conquer where those before had been conquered and to find the path to financial freedom have realized that the housing market can be unforgiving and treacherous when the music stops.

“Of our 11 rentals, five of them flipped the same month,” she said. “The leases were up, and we missed that school move-in time, and for the first time in five years, half of our rentals are empty and that’s super, super, super stressful.”
As Mina’s long-term rental business suffers and she prepares to hang up her hammer as Good Bones’ last show airs, a new show premiered to much acclaim at the New York Film Festival this week about a “camera-friendly couple” who “wants to bring sustainable living to small-town New Mexico, and they aim to star in their own HGTV show while doing it. Between Whitney’s eco-friendly designs and Asher’s steady accrual of local properties, there’s plenty of goodwill and potential built into their pitch.”

Quickly, however, I hear things get a little dark. I for one am very much looking forward to this “brilliant, wild, perverse, hilarious, uncomfortable, and anxiety-inducing” new show which promises to have some interesting undertones and themes. I may have to resurrect my Showtime subscription.
These two news stories reminded me of an anecdotal story one of my followers recently told me of a dinner in Austin with two other young couples. My follower has been trying to buy in Austin for the past year but has refused to pay the ridiculous prices. At this dinner, the two other couples in attendance had both bought second homes to fix and flip. Both couples had to put those plans on hold due to construction costs and rising taxes and insurance. One wonders how long they will try to hold on before surrendering and listing for sale?
Inventory is rising and even the naysayers are starting to admit it, going a little quiet. We, dear readers, have seen inventory increase in many cities all year (and since April on an aggregate basis), but there does seem to be a shift and acceleration occurring.
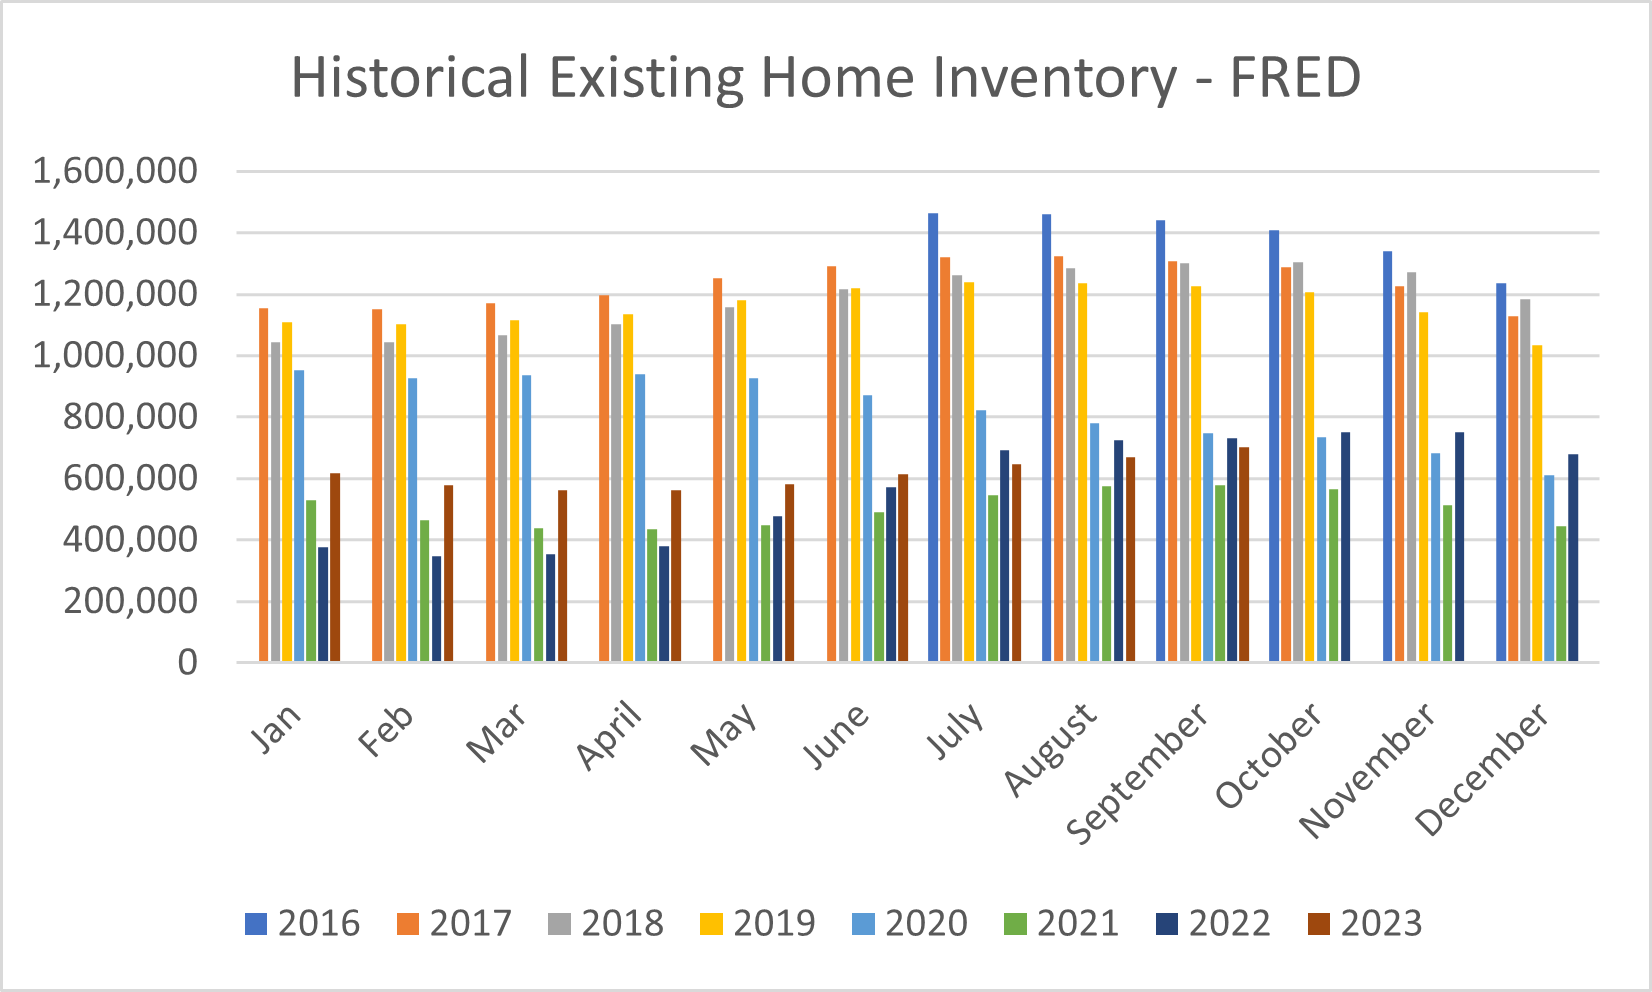
The above series only goes back to 2016, but while many are saying things like “inventory is rising at a non-seasonal time,” if you use the FRED data, inventory seems to almost always peak between July and October. Makes me curious why certain folks are out there with this message, but let’s shelve that for now. I honestly do believe based on everything I’m seeing in mortgage books and hearing from lender clients and anecdotal stories - that indeed inventory will continue to rise, especially new-build inventory. My guess is we end the year between 4-5 months of existing inventory (currently at 3.3) and 9+ months of new-build inventory (currently at 7.8). We have stagnated at the 3.3 months of supply for existing homes for several months. Ever wonder who determines the number of months of supply needed to be deemed healthy for the existing homes market? Why the National Association of Realtors of course, who are having all kinds of fun these days:
Historically, six months of supply is associated with moderate price appreciation, and a lower level of months’ supply tends to push prices up more rapidly.
So, six months for existing homes, but what if new homes are a higher % of the market than their historical average? Some in the media want to argue that historically new homes only make-up 10% of the market….but what does that really matter if someone is looking for a home? Some say it’s because new homes are pricier. We know this year at least the builders through their buydowns have been able to effect a 15-25% net price reduction, so that argument doesn’t really hold water. Since 1963, we have averaged 6.1 months of new-home supply. If only we had this same series from the Fed for existing homes.*
At the moment we have 1.7 months in excess of the average of new home-supply and are at 3.3 months for existing, putting us around 5 months of inventory. My point? There is no science to this, not really. This is all about narrative. And in the many cities where we have much more inventory - way more - some recent sellers have been surprised as inventory sits in what was considered a very hot market a few short months ago. Riddle me this - what does healthy supply look like when investor appetite - large and small - wanes as Mina and her kind close this chapter?
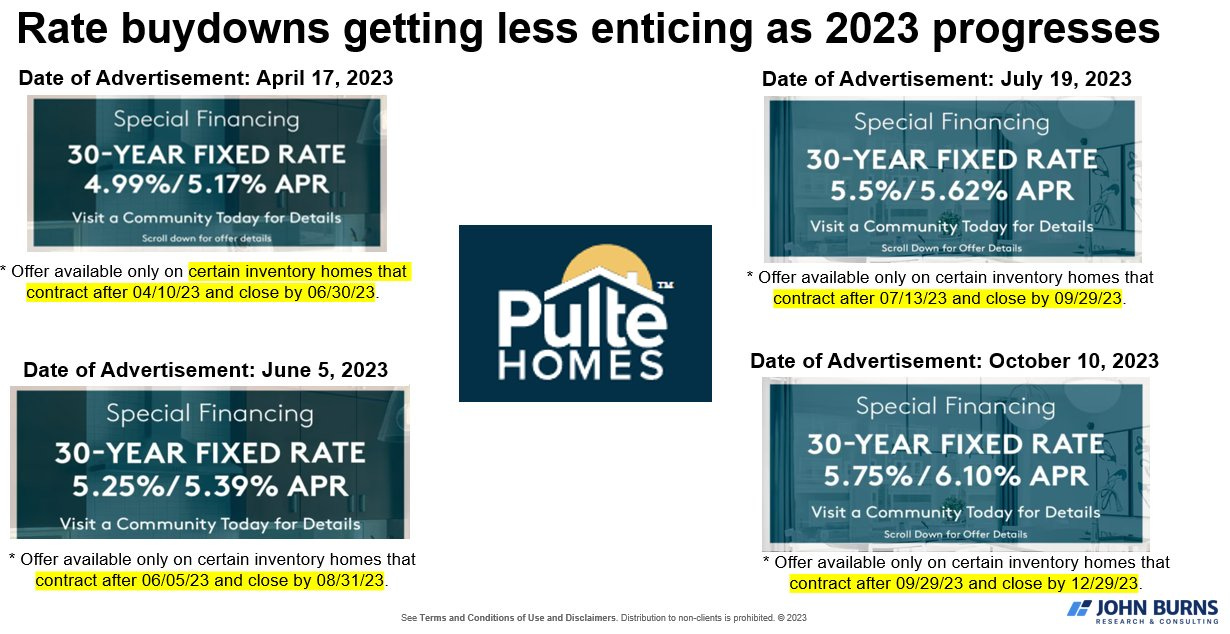
Speaking of builders, Halloween approaches and the end of the road for the builder bonanza seems to be in the cards as margins compress and buyer financing no longer pencils due to rates ascending their latest peak.

h/t: Mr.Awsumb
Oh wait - my bad -that, my friends, was from October 2007. Here is a snippet of Pulte’s current advertisements illustrating how those rates have gotten less attractive as the year has progressed….is another Halloween sale in the cards?
If not, though, Lennar is here to save the day in Colorado at least:

h/t: @1NickSilveira
In other news this week, Newsweek (I mean Newsweek!) published an article discussing the oncoming avalanche of homes that we will see coming to market in the next year due to our aging demographics and affordability issues:
This stalling situation between demand and supply will change in the coming year, Whitney said, as Baby Boomers—the generation born between 1955 and 1964 and which represents a big portion of homeowners in the U.S.—put their homes on the market in an effort to downsize and save money. According to the U.S. Census 2021 data, the latest available, only 10 percent of American homeowners were under the age of 35.
Ouch! Here’s a visual from my pal @GRomePow:

But by all means, NAR, MBA, NAHB, etc., let’s cry to Daddy J and put our heads, collectively, in the sand. Similarly, the multifamily narrative seems to be that yes, indeed, we will have a ton of supply coming on in the next couple of years, depressing rents until we right-size in 2026 and beyond. Like, what? Rents are declining across the country due to increases in occupancy resulting from new supply, jeopardizing many investments as extend and pretend is no longer an option for many.

I’ve heard from several of you about investments in rental communities or buildings that are now on the rocks. Just as many became landlords in the run-up to the Great Depression only to never want that position again as the fallout was too much to stomach, are we finally turning the corner on this era of housing roulette? Housing is emotional (see above) and thus highly susceptible to mania as just about everyone balances fear of losing shelter while also, always, wanting to keep up with the Joneses.
Truly, truly, could our fever dreams finally be dissipating as winter approaches?
The chill in the air seemed a bit more sinister this week as each time you checked your newsfeed something more dire flashed across the screen as geopolitics and markets convulsed, nauseatingly. As we close the week there are stories of a bank run in China and fears of escalation as war rages abroad. At times like this we need to seek our better selves, shelving that snake-brain fear, to ensure that our humanity prevails in our interactions with others. You never know the pain and sorrow they may be carrying.
May next week bring better news…or at least more compassion.
*If anyone has or knows of an older data series for existing inventory, please point me to it as I do find it fishy that this “new” series started right smack dab in the middle of our fix and flip mania.
Listings for Sale
Of the 71 cities, I track 41 had week-over-week inventory increases. In aggregate, listings for sale were up week-over-week by .32% and 3.14% to the average.
Top Cities with Largest % Increase in Inventory Week-over-Week (10/1-10/08):
Portsmouth 6.33%
Palm Springs 6.16%
Boston 4.53%
Raleigh 4.40%
Cape May 4.24%
Top Cities with Largest % Increase in Inventory Compared to 14-week Average (10/1-10/08
Bakersfield, CA 48.82% (perhaps a data issue - will check next week)
Portsmouth 18.77%
San Francisco 18.09%
Salt Lake City 11.66%
Cape May 11.62%
Top Cities with Largest % Increase in Inventory from Start (1/1/23)
San Francisco 102.96% (up from #2 and seems to be re-accelerating)
San Ramon 86.67% (down from #1)
Bakersfield 77.45% (potential data issue)
Coeur d’Alene 72.80% (down from #3)
Denver 69.57% (down from #4)
Salt Lake City 47.63% (up from #9)
Austin 47.21% (down from #5)
San Jose 46.25% (down from #6)
Galveston 44.32% (down from #7)
Portland 44.21% (down from #8)
*Bozeman was kicked out by Bakersfield (perhaps a data issue)
Top Cities with Highest % Increase of Single-Family Rental Listings (10/1-10/08)
Listings for rent were down slightly week-over-week at -.05%, but up compared to 14-week average by 6.78% and up in many interesting markets (42 markets overall).
Couer d’Alene 11.11% (listings for sale down -3.33%)
Rochester 10.06%
Bozeman 6.97% (listings for sale down -.82%)
Johnson City 6.58%
Boise 6.41%
Top Cities with Highest % Increase of Single-Family Rental Listings to 14-week Average
Cape May 138.64%
Rosemary Beach 80.00%
Galveston 32.03%
Couer d’Alene 21.32%
San Diego 19.89%
Honorable mention: Nashville at 14.17%
Top Cities with Highest % Decrease of Single-Family Rental Listings (10/1-10/8)
Sevierville -26.67%
Portsmouth - 17.86%
Costa Mesa -16.17%
Sedona -9.52%
El Cajon -6.10%
Top Cities with Highest Decreases in Occupancy for September Year-Over-Year (RealPages)
*Important to note that all the cities with occupancy information available on RealPages showed decreases in occupancy when compared to last year
San Antonio -2.32%
Boise -2.30%
Indianapolis -2.06%
Atlanta -1.94%
Augusta -1.87%
Airbnb/VRBO - Short-Term Rental
Top Cities with Biggest Decrease in Airbnb Average Daily Rate Week-over-Week Compared to Average
Average daily rates were down on average -15.50% compared to their 14-week average
Rosemary Beach - 52.07%
Destin -38.96%
Ventura - 37.58%
Miami -32.85%
Fort Lauderdale -32.84%
Top Cities with Highest % Decrease in STR Listings Year-Over-Year
September listings for short-term rental were up 13.28% compared to September 2022, while Average Daily Rate was up 0.47% and occupancy was down-0.87%.
*Telling that only 2 cities had year-over-year decreases in listings
Fort Myers -37.49% (Ian)
Westchester -11.11%
Top Cities with Highest % Decrease in STR Listings Month-Over-Month
Westchester -20.00%
Hoboken-14.24%
Indianapolis -9.05%
New York -8.54% (AirDNA uses a 3-month average, so this will come down significantly)
Missoula -3.62%
Top Cities with Highest % Decrease in Average Daily Rate (ADR) Year-Over-Year
Fort Myers -22.56%
Palm Springs -15.32%
Destin - 12.69%
Scottsdale - 11.40%
Chicago -11.17%
Top Cities with Highest Average Daily Rate - September 2023
Westchester $951.56
Newport Beach $765.06
Rosemary Beach $733.34
Cape May $665
Encinitas $611.72
Top Cities with Highest Average Daily Rate - September 2022
Rosemary Beach $763.23
Newport Beach $750.16
Palm Springs $704.31
Cape May $648.42
Westchester $558.47
Commercial Real Estate (CRE)
Rudy’s Substack earlier this week has some incredible info about what is ahead in CRE, so don’t miss it (linked to the quote below).

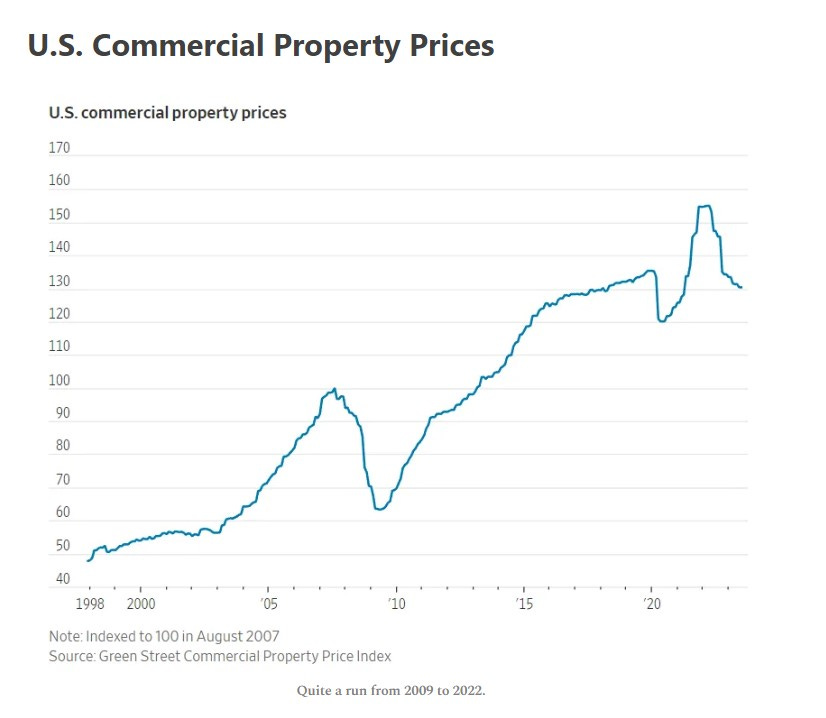
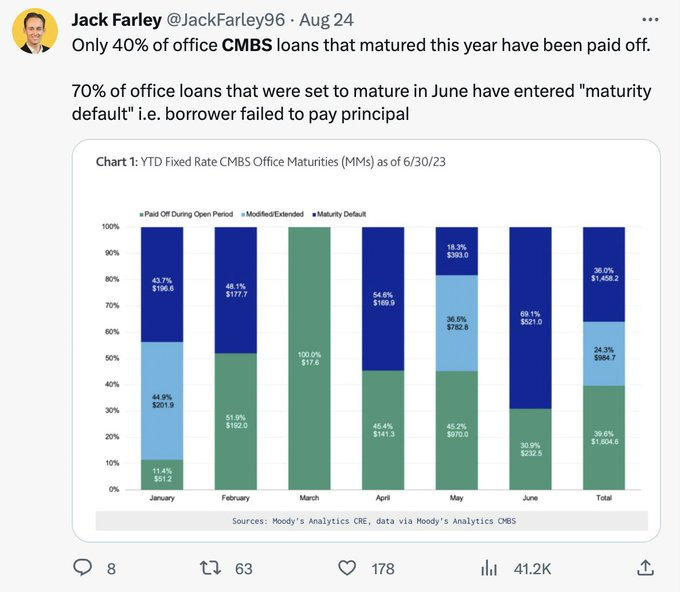
And, someone else seems to be paying attention as this week we finally have an article about our issues in commercial real estate outside of Work-from-Home

Don’t miss this article on The State of Multifamily Lending | GlobeSt.
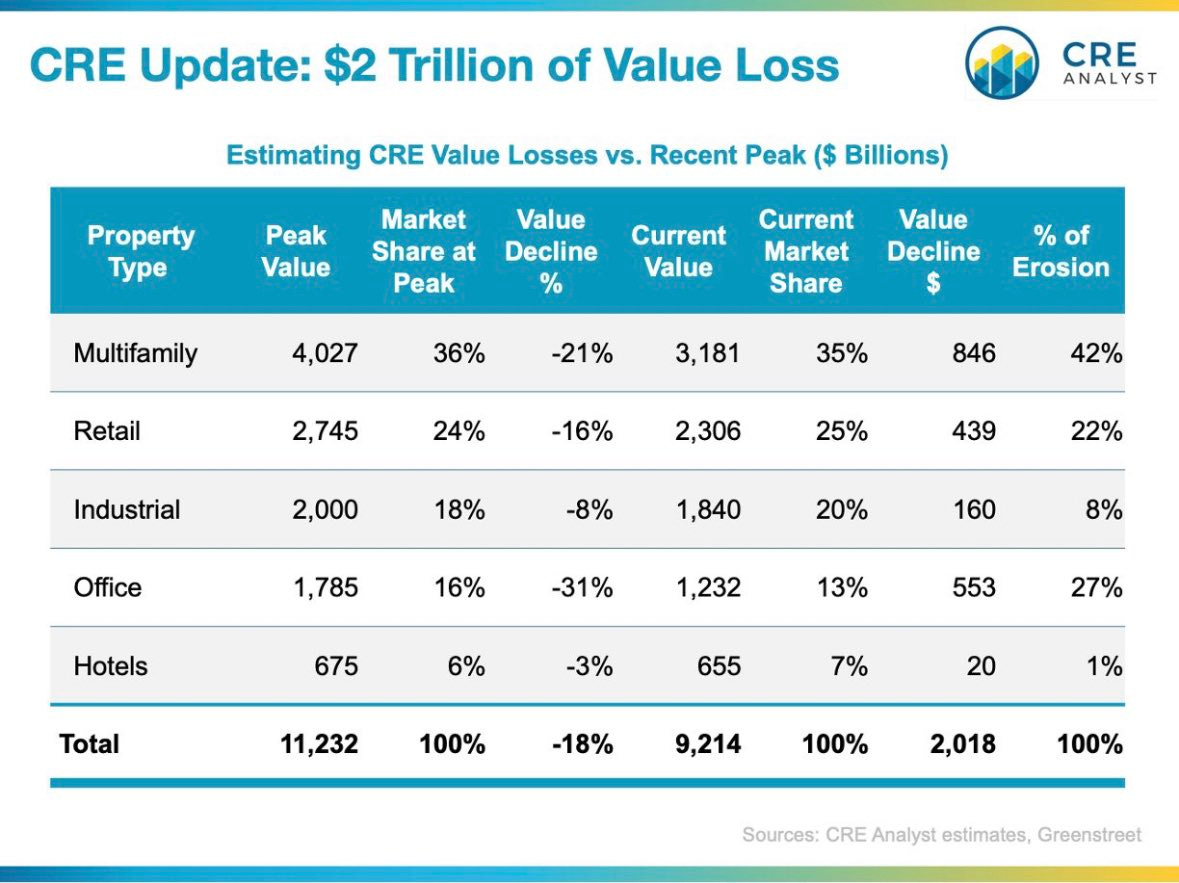
And, even though I think we are over-supplied even if EVERYONE returned back to work (see above), this chart is telling about our current situation (h/t Jim Bianco):
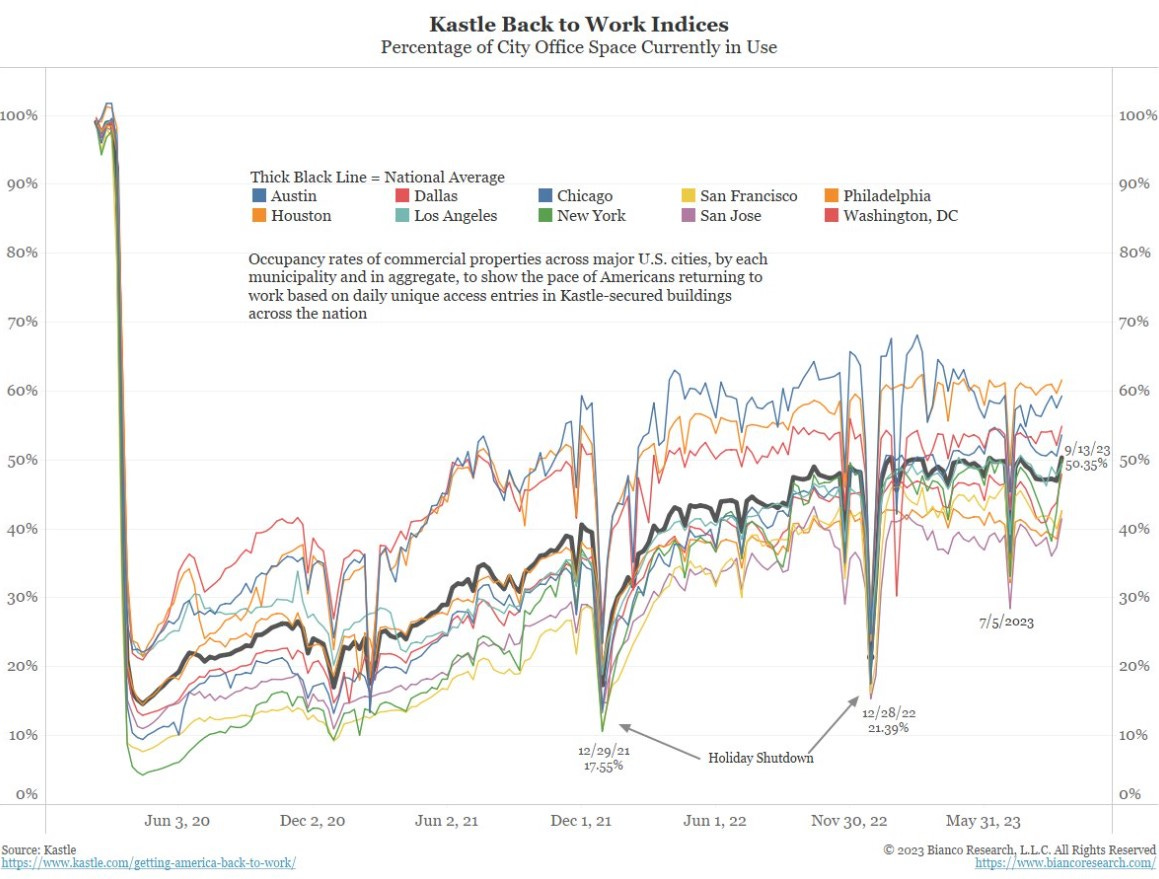
Keeping some charts here for now as I think this will look much worse in a year.
Reference articles:
Distressed Commercial Real Estate Loans Surge Nationwide (therealdeal.com)
Commercial real estate loan workouts: strategic approaches for the financial industry | Reuters
Here’s How People Are Returning to the Office Worldwide - The New York Times (nytimes.com)
Return-to-Office Is a $1.3 Trillion Problem Few Have Figured Out (yahoo.com)
Asset managers look to sell Hong Kong buildings as higher rates bite | Reuters
CIBC to focus less on US office real estate after profit miss | Reuters
Industrial Absorption Drops 67.3 Percent from Last Year (trepp.com)
Cannae Advisors, Morgan Stanley Buy $174M Debt Attached to Albany Mall – Commercial Observer
EY: Five Takeaways from a Recent Look at Office Trades - Connect CRE
Blackstone Selling 22% Stake in Bellagio to Cash In on Las Vegas Rebound - WSJ
Landlords With $1.2 Trillion of Debt Face Rising Default Risks - Bloomberg
Office Tenants Are Renewing Leases—but for Far Less Space - WSJ
Plunder: Private Equity's Plan to Pillage America: Ballou, Brendan
More articles linked below in the reference section below….
Reference
Rent as well as market summary to be provided in the next week or so.
Rent
As mentioned here previously I have been struck by how little movement there has been using RealPages, but this month I noticed something interesting. RealPages started including some statistics in its write-up of each city including year-over-year changes in occupancy for all but a few key cities which is telling in and of itself. In case you haven’t seen this, RealPages is currently under investigation by the DOJ.
Average year-over-year decreases in occupancy for the cities I track and the cities that RealPages lists is -1.57%. Some of the key cities that are missing these stats in their write-ups: Chicago, Dallas, Houston, Nashville and Phoenix. Someone has shared a new source with me that I will be looking at next week as well.
Top Cities with Highest % Decrease in Average Rent June to July
Nashville -15.92%
Asheville -13.71%
Coeur d’Alene -11.88%
Destin -10.28%
Chicago -9.68%
Top Cities with Largest Decrease in Occupancy Year-Over-Year
Augusta -3.09%
Tucson -2.44%
Boise -2.30%
Atlanta -2.30%
Indianapolis -2.18%
Notable Mention: Miami - 1.91%
Airbnb/VRBO - Short-Term Rental (STR)
Top Cities for Short-Term Listings July
New York 26,809
Miami 14,502
Las Vegas 13,913
Los Angeles 11,765
Houston 11,588
Austin 10,911
Atlanta 10,879
San Diego 10,746
Orlando 9,763
Sevierville 8,816 (knocking out Nashville from June)
Top Cities with Biggest Increase in Short-Term Rental Listings Jun-July
Fort Myers 14.35%
Indianapolis 6.53%
Las Vegas 6.43%
San Diego 6.24%
Oceanside 5.32%
Top Cities with Biggest Decrease in Short-Term Rental Listings Jun-July
San Jose -6.37%
Phoenix -5.25%
Portsmouth -4.85%
San Ramon -4.30%
Tucson -4.16%
Top Cities with Biggest Increase in Short-Term Rental Listings Jan-July
Destin 37.32%
Coeur d’Alene 36.71%
Cape May 31.94%
San Ramon 28.99%
Palm Springs 22.49%
Top Cities with Biggest Decrease in Short-Term Rental Listings Jan-July
San Jose -21.04%
Dallas -18.02%
New York -13.39%
Fort Myers -11.82%
Houston -8.53%
Top Cities for Short-Term Listings July
New York 26,809
Miami 14,502
Las Vegas 13,913
Los Angeles 11,765
Houston 11,588
Austin 10,911
Atlanta 10,879
San Diego 10,746
Orlando 9,763
Sevierville 8,816 (knocking out Nashville from June)
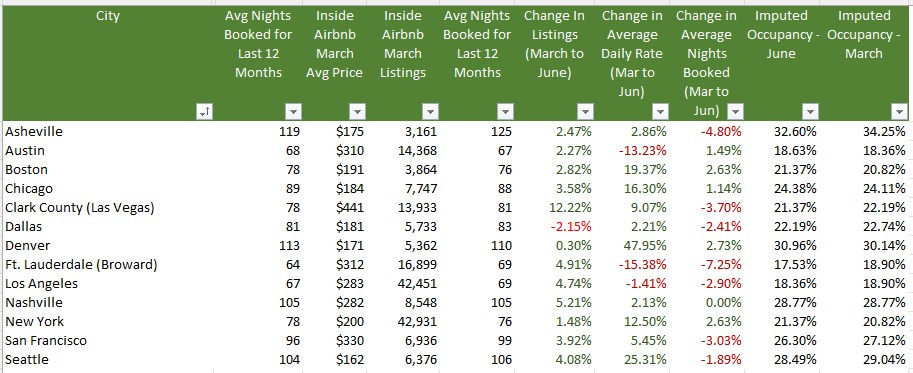
From Inside Airbnb
As I’ve mentioned previously all data is not equal. Inside Airbnb has incredible data, but it is only for a handful of cities and is published once a quarter. Their listings tend to be much higher than the data provided by AirDNA and others, but they trend in the same direction. In October I will do a deep-dive on the differences and trending so we can see how closely the myriad data sources track. But, for example, Inside Airbnb data shows Nashville with 8,993 listings at the end of June while AirDNA has 8,105.
Only one city in the cities they track- Dallas - showed a decrease in listings from March to June which was likely due to the recent legislation. As the stock market took off so did everyone’s hopes and dreams. Unfortunately, I believe that not only will legislative efforts start to tick up (Airbnb’s lawsuit against NYC was dismissed last week), but the sentiment will likely sour in the next months based on macroeconomic clouds that are gathering.
Historical & Monthly Comparisons
Lowest Occupancy July 2023
Augusta 55.33%
Winter Garden 51.40%
Palm Springs 52.02%
Phoenix 54.68%
Sedona 54.60%
Lowest Occupancy July 2022
Palm Springs 50.45%
Sedona 50.93%
Tucson 52.00%
Phoenix 53.78%
Augusta 55.33%
Highest Occupancy July 2023
Destin 91.44%
Newport Beach 91.21%
Cape May 90.50%
Rosemary Beach 88.91%
Oceanside 88.87%
Highest Occupancy July 2022
Cape May 93.39%
Rosemary Beach 89.34%
Destin 88.97%
Westchester 87.17%
Oceanside 87.17%
Commercial Real Estate
Going to keep this incredible podcast with Jack Farley, John Toohig and Randy Woodward in this section until they do the next one - it’s just that good.

Per John, the only commercial real estate trading at the moment is for Trash and Trophies and despite MSM narratives trouble is on the horizon. Miss this at your own risk.
Additional Articles
Loop landlord files for bankruptcy ahead of foreclosure sale | Crain's Chicago Business
Google Looks To Offload Another Big Office Campus in Silicon Valley (costar.com)
WeWork Risk Seen in Commercial Mortgage Bonds, Barclays Says (yahoo.com)
Big Banks Are Trying to Dump Commercial Real Estate Debt As Pressure Mounts (businessinsider.com)
The Commercial Real Estate-Small Bank Nexus | ZeroHedge
Local Malls, Stuck in ‘Death Spiral,’ Plunge in Value - WSJ
Troubles for Wall Street office tower worsen as foreclosure looms (nypost.com)
Understanding the challenges in the U.S. commercial property market
Commercial Property Investors Huge Office Bet is Unraveling In London, New York and Paris
Commercial Real Estate Reset is Causing Distress from Sand Francisco to Hong Kong
CRE’s Strains are contained: But in a recession the dam won’t hold. (contained you say?)
Big commercial real estate downturn could sink 300+ banks: Report | American Banker
Westfield Gives Up Downtown San Francisco Mall (sfstandard.com)
Goldman Sachs CEO Solomon warns of commercial real estate write-downs (cnbc.com)
Hotel Owners Start to Write Off San Francisco as Business Nosedives - WSJ
Sunbelt Construction Boom Threatens Top Apartment-Building Owners - WSJ
US banks prepare for losses in rush for commercial property exit | Financial Times (ft.com)
Interest-Only Loans Helped Commercial Property Boom. Now They’re Coming Due. - WSJ
wonderful article. thank you
Those additional article headlines seem cheerful. 🫣