As Tropical Storm Hilary descends on the Southwest and California, I am looking out at the Atlantic from Miami, thankful it isn’t Florida’s turn….yet. Does anyone else find it creepy that the last time there was a storm like this was in the 30’s? If you are not familiar with Shawn Hackett, I highly recommend checking him out. His work on weather-pattern forecasts has been on the nose and helps us understand the impacts through a historical lens. In case you didn’t know, we are in the middle of a significant weather pattern called Grand Solar Minima which started in 2008 (gulp) and is partly the cause of the extreme weather volatility we have been experiencing. And, unfortunately, it’s likely to continue for the next thirty years. Think Dust Bowl which came in three waves: 1934, 1936 and 1939-1940. Shawn’s forecast on crops and cattle is critical to hear to understand potential food shortages in the coming years. Hopefully the insurance companies follow Shawn, and maybe they do and that is why they are heading for the exit in many states. Full of good news as usual, I know, but forewarned is forearmed.
With the devastation in Lahaina, Maui following an already challenging start to the year, insurance companies will most certainly pass those costs to the homeowners. In Florida this week, a near riot ensued in a 55+ community called Century Village when they learned their HOA fees were being raised due to “skyrocketing insurance premiums.” It took dozens of police officers to calm the scene:
"One security guy — and he was one of the supervisors there — he was a big guy, and he grabbed this little old man and picked him up and threw him out into the street like he was a ragdoll," Hutchinson said. "I couldn’t believe it!”
Case Study #1
Century Village is a modest community with apartment homes listed between $179K-$350K (one delusional listing for $450K) and rentals for $1,500-$2,800.
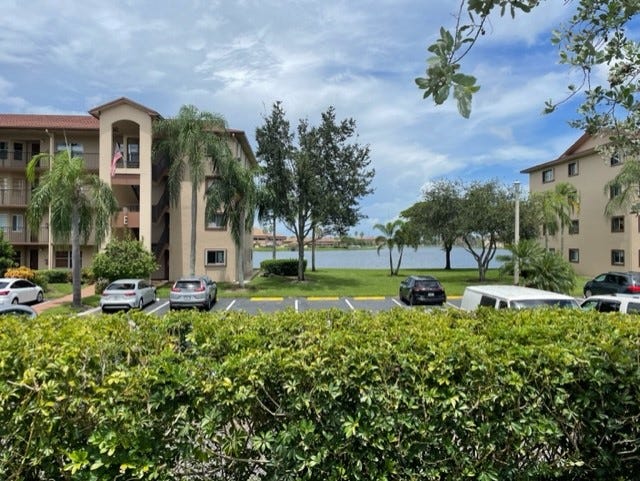
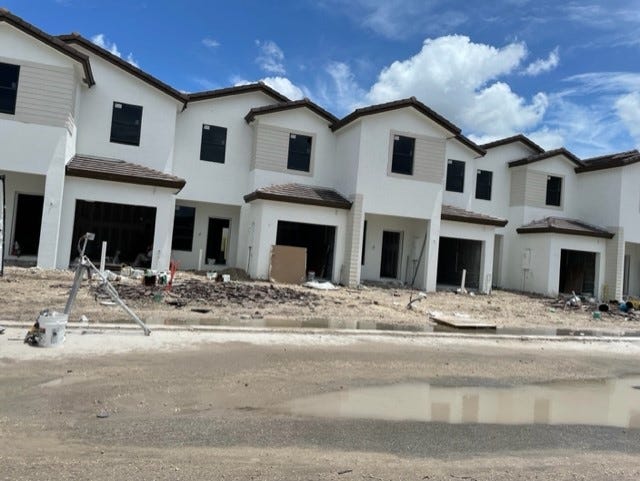
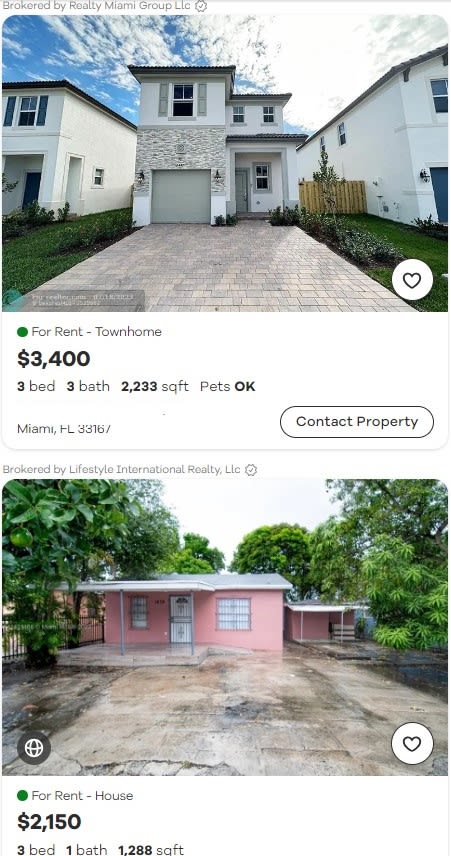
I drove by yesterday, and although I was unable to get into the gated property, I sneaked this pic. It is a massive complex with over 9K residents per one website of what looks to be solidly middle-class residents. The adjacent area is also fairly modest with your typical chain restaurants such as Cheddar’s, etc. - nothing fancy. From Century Village, I drove three short miles to a Lennar new-build site called Sunset Pines. This location is adjacent to what looks like a fairly new retail strip mall which includes a Publix. But, the area is still largely middle to lower-middle class. Here’s what Lennar thinks they will get for these zero-lot line spec homes.
Most of the homes in Century Village are two-bedrooms, but if we do cost per square foot, we can see the difference. The ones in Century Village are between $200-$322 per square foot (including that one for $450K). The new Lennar homes just a couple of miles away that do not include any of the amenities at Century Village are going for between $374-$422 per square foot. More importantly the refrain from the video interviews of the residents of Century Village is that they would be listing their homes for sale or had already done so as they simply could not afford a cost increase on a fixed income. So, who exactly will be buying these lovely little spec homes?
Notice anything else about the Lennar listings? Well, it says they will be available in January 2024, but many are close to being finished now. And, they should be as we’ve been told they can build a spec home very quickly. One reason may be that as they get closer to the end of year it makes sense not to get that final certificate of occupancy as the property will be taxed as land until that is completed (h/t TrishFLSun). This is what I have seen over and over on the road, especially in Austin. The listing sites like Zillow, Redfin and Realtor which are connected to the MLS either do not have these homes listed, or they have one or two - not the entire subdivision.
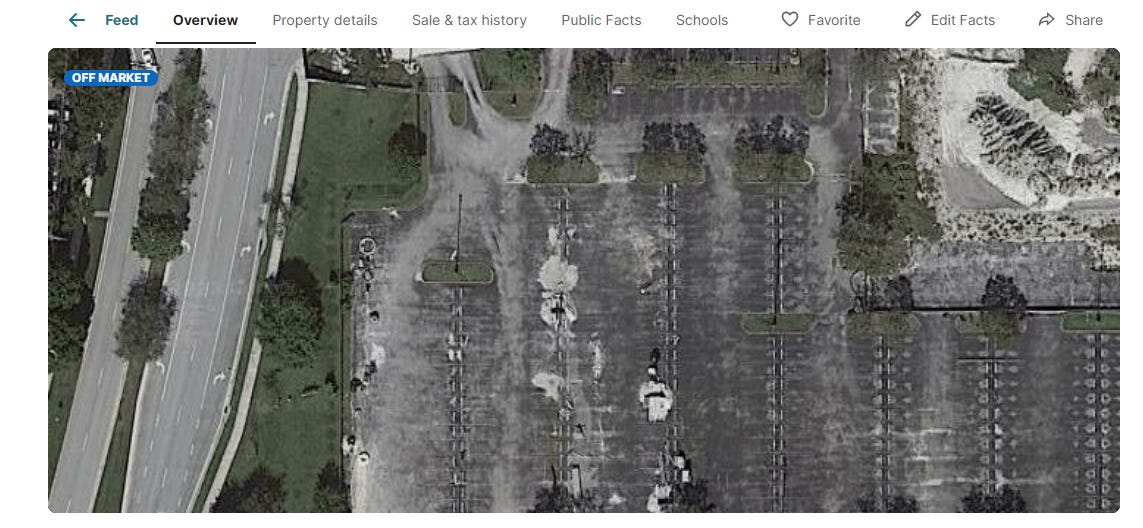
This is what Redfin currently shows for the Lennar construction site pictured above:
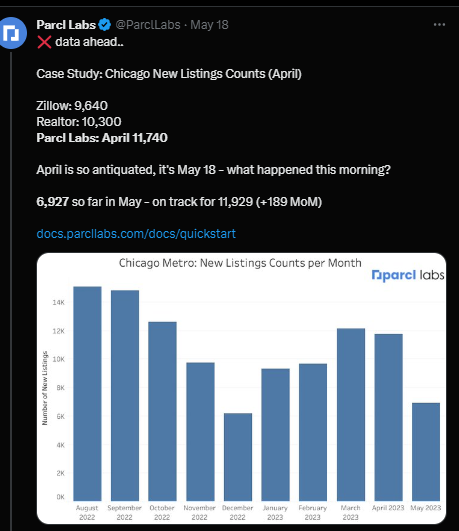
So, we have spec homes that are not listed on the listing sites. Now, let’s add the existing homes which are not listed. On the Century Village website there are over 100 homes listed for sale and rent. On Realtor.com there are only sixteen listed for sale. I have talked many months about the fact that many people don’t want to list on MLS and do end-runs with Facebook posts, local websites, etc. So, when the talking heads on Twitter (and no, I won’t be calling it X), say there is no inventory they do not realize that the data upon which they rely only has about 60% of the listings based on the conversations I have had with these data providers. And, I have been digging in after getting back from the road in February. I also believe the builders are strategic with listing one on Zillow, one on Realtor and one on Redfin versus listing them all. Parcl Labs, whose mission is to “index every property on the planet” is doing incredible work to solve this issue by collating these different sites as well as linking to county records and other sources. I think they are getting close to truly being able to track inventory like it’s 2023.
But, but, but the permits! I have talked about this a lot but there is something fishy in the Survey of Construction. It could simply be issues I’ve discussed with lower responses to the survey, or something else.
Onward….
Once I finished in Pembroke Pines, I headed over to another Lennar community in Westview. Most of what I saw as I drove looked to be blue-collar. They have several subsidized apartment complexes. One local told me she pays $1,300 for her two-bedroom.
An example from Realtor.com of the juxtaposition:
There was a lot of security at this new-build site so I had to race around a bit. But check out these gems, none of which are listed on Realtor.com. The only thing I can find is one listing for rent for $3,100.
And this was just one section of the development.
Are you starting to get the picture? We simply have no idea how much inventory is out there. This is a case study from just two sites. I have visited hundreds in Austin; Charlotte; Nashville; Orlando; Jacksonville; Lakeland, FL; Las Vegas; Phoenix; Pittsburgh; Charlotte County, FL and now will be spending some time here in Miami. If I were a better videographer I would have hours and hours of footage. But, I am severely challenged when it comes to A/V. I hope to get some tools soon that will help in this department.
So, that is it for Case Study #1 from Miami. I’m hoping to do a deep-dive on Lennar specifically in the next few weeks.
For Case Study #2 we are going to focus on the new term I’ve coined: Airbnbroke.
I have mentioned here before the Debt Service Coverage Ratio (DSCR) loans which are essentially the Alt A, stated income loans - and many are interest only - we saw in the last cycle that people have used to fund these short-term and long-term rental properties. I know very responsible lenders who do these loans within the investor parameters, but a large component of the underwriting relies on income projections and not necessarily historical performance as for a new-build, for example, there is none. You can only use comparable properties. But, what makes a comparable property?
A scenario: you hear about your buddy who bought a short-term rental property in Austin and is making bank. You start googling and find people who will help you find one. Because there is so little existing inventory left on the market, they send you pretty brochures of a new-build spec. You pick one of the specs or you commission a new-build. You sign up for a service like AirDNA to get projections. Many investors and lenders rely on these services. You search your property and pretty soon you think you are going to be a millionaire. You do not question how they have come up with this number, or how they would have comps for a new-build community 20 miles south of Austin. Next step- find someone to lend. Typically you are referred to an accommodating lender.
In one of my client’s portfolios right now I have a delinquent loan that is a second home in Kyle, Texas which is 22 miles south of Austin. There are currently about 58K people in Kyle, Texas with a median household income of $80K. This location was likely sold as a happening suburb of Austin. The only attraction seems to be a cool bowling alley that also has some games and theaters. Using data from the leading provider of these projections for STR, this property is forecasted to have an average daily rate (ADR) of $637 and an occupancy rate of 55% for monthly income of $10,752. Now, I cannot say for sure whether this individual bought this home for short-term rental or long-term rental. What we do know is that many started to do STR for financing purposes because it could look like you would make a ton more money. For these loans you have to show projections for income in order to get the financing right.
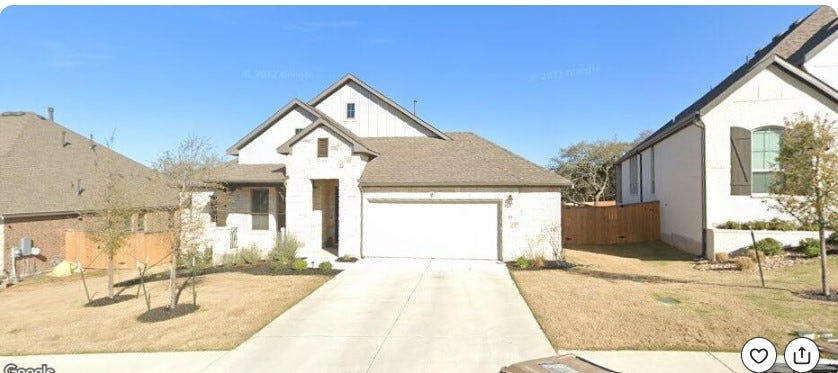
The borrower mentioned above bought this little jewel, 22 annoying miles south of Austin, in a subdivision full of the same thing for $585K:
So, what’s happening now? They got smacked with a $17K tax bill in January that they didn’t pay. The servicer forced escrow, increasing their monthly payment. The borrower is now desperately trying to sell. But based on the amount of inventory in Austin (please check out this video if you missed it from one Austin neighborhood) - inventory listed and not listed - and the new multifamily much closer to the city, the only way this sells is if at this point of the cycle they can find another sucker.
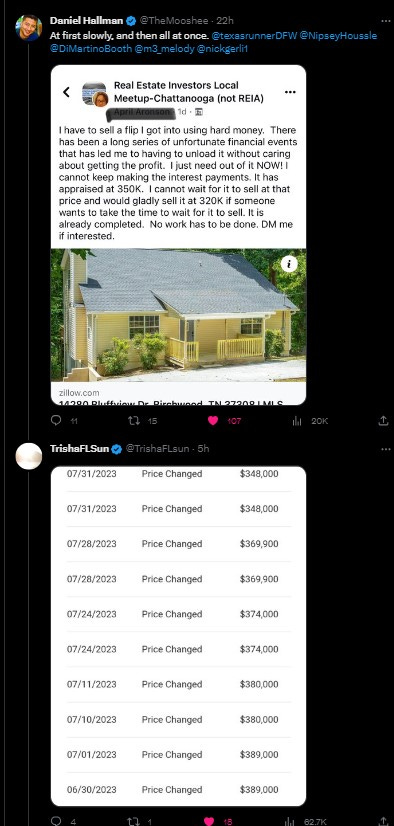
And, this investor class travels in packs and are “in it together,” meaning that they all understand what happens when someone sells at a distressed price. Take this tweet from today which features a desperate holder:
They tell their community they will let it go for $320K, but they aren’t listing it that way even though they sound completely desperate. And, these people are doing crazy things like deeding properties to one another not realizing that we follow the Uniform Commercial Code in most states in this country and possession of the original note is what matters. But that is a post for another day.
So, in summary, we had a bunch of mom-and-pop investors inexperienced in any type of landlording pile into this leading to the #airbnbust where they tried to charge exorbitant amounts at the same time as asking you to clean the pool. Now that same investor class due to low demand this summer is struggling to make their payments either on their mortgages, hard money loans, or whatever leverage they used including loans on their stock and cryto portfolios. To understand how pervasive this phenomenon is, you only have to look at just how many of these exist. Inside Airbnb did an incredible study on Dallas, and I believe Dallas isn’t even as bad as Austin, Phoenix or Las Vegas.
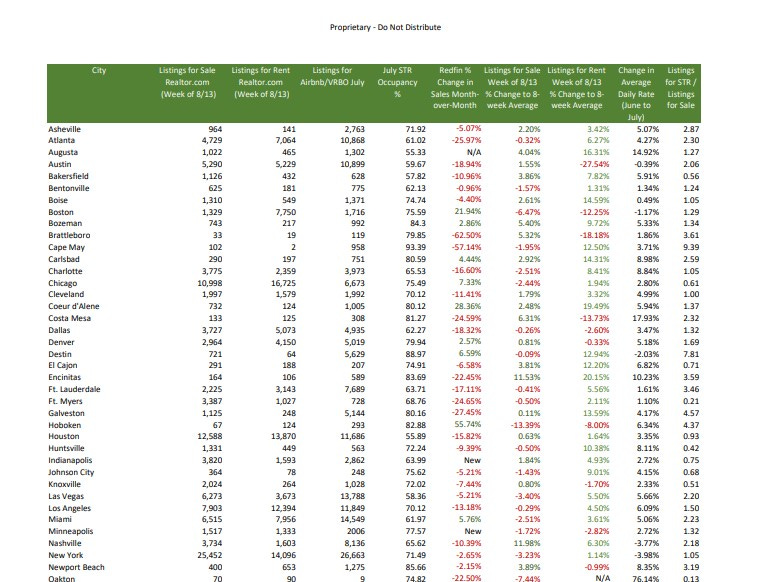
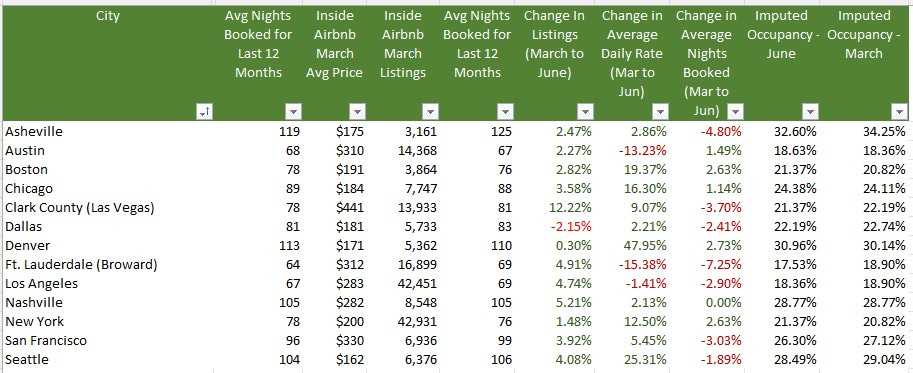
Please find a snip of the summary schedule of listings for sale, rent and Airbnb for the cities I track below. The pic is linked to the Google Doc. You will just need to request access, or contact me on social media. Additionally I added the ratio of listings for Airbnb / listings for sale. So, in Asheville, for example there are 2.87 Airbnb properties to every property listed for sale. I truly hope to create some visual aids as well in the future, but there is only so much time…
Now that you can see just how many of these there are in these cities you can start to understand - unlike most of the housing analysts out there - the implications to the housing market.
Can I get a Ruh-Ro? A good friend of the show, Mr. Awsumb, reminded me that the real bad guys in Scooby Doo are always the land developers, or people who try to steal your land or property so they can turn a profit.
As you make your investing and homebuying decisions please, please take these case studies to heart. Unfortunately, though, in one way or the other, I think we are all going to end up a little Airbnbroke.
*Summaries will be added to this post tomorrow, but one important note - sales were down, way down (almost 10%) for the cities I track June to July.
Listings for Sale
Listings are down week-over-week -.45% when looking at the average, but I’m not using a weighted average, so there were some big moves impacting the #.
Top Cities with Largest % Increase in Inventory Week-over-Week (8/6-8/13)
Rosemary Beach 11.11% (up from #2 last week)
Westchester County 7.07%
Augusta 6.24%
Portsmouth 5.71%
Rochester 4.71%
Top Cities with Largest % Increase in Inventory Compared to 8-week Average
San Ramon 19.61%
Nashville 11.98% (up from #4 last week)
Encinitas 11.53%
Rosemary Beach 9.95%
Costa Mesa 6.31%
Top Cities with Largest % Increase in Inventory from Start (1/1/23)
San Ramon 136.67%
Coeur d’Alene 89.64%
Denver 57.16%
San Francisco 53.50% (up from #5)
San Jose 50.97% (up from #7)
Austin 54.52% (down from #5)
Carlsbad 42.86% (up from #10)
Galveston 42.05% (up from #9)
Portland 41.90%
Bozeman 37.08% (knocking out Nashville)
Top Cities with Highest % Increase of Single-Family Rental Listings (8/6-8/13)
Rosemary Beach (small numbers, but a real move) 100.00%
Portsmouth 50.00%
Galveston, TX 15.89%
Carlsbad 12.57%
Encinitas 11.58%
Top Cities with Highest % Increase of Single-Family Rental Listings to Average
Rosemary Beach 24.14%
Encinitas 20.15%
Portsmouth 20.00%
Couer d’Alene 19.49%
Augusta 16.31%
Top Cities with Highest % Decrease of Single-Family Rental Listings (8/6-8/13)
Brattleboro -17.39%
Sevierville - 16.67%
Costa Mesa -6.02%
Oceanside -5.31%
Boston -5.06%
Airbnb/VRBO - Short-Term Rental
On average, short-term rental listings in the cities I track increased by 1.28% from June to July and 6.02% since January. These moves are consistent with what I’ve been hearing anecdotally on social media…there are still FOMO’ers jumping in, but the rate of that change is slowing from last year. From January to July of 2022, short-term rentals in these cities increased by 23.14%.
Top Cities with Highest % Decrease in Average Rate Compared to 12-Week Average
Rosemary Beach -49.16%
Hoboken -28.89%
Indianapolis - 27.76%
Destin -27.67%
Sedona -19.52%
Top Cities with Highest Average Daily Rate - July 2023
Newport Beach $771.53
Westchester $744.91
Rosemary Beach $720.82
Cape May $592.29
Encinitas $576.17
Top Cities with Highest Average Daily Rate - July 2022
Rosemary Beach $799.85
Newport Beach $767.51
Westchester $619.46
Cape May $579.92
Encinitas $570.53
Lowest Occupancy July 2023
Augusta 55.33%
Winter Garden 51.40%
Palm Springs 52.02%
Phoenix 54.68%
Sedona 54.60%
Lowest Occupancy July 2022
Palm Springs 50.45%
Sedona 50.93%
Tucson 52.00%
Phoenix 53.78%
Augusta 55.33%
Highest Occupancy July 2023
Destin 91.44%
Newport Beach 91.21%
Cape May 90.50%
Rosemary Beach 88.91%
Oceanside 88.87%
Highest Occupancy July 2022
Cape May 93.39%
Rosemary Beach 89.34%
Destin 88.97%
Westchester 87.17%
Oceanside 87.17%
Commercial Real Estate (CRE)
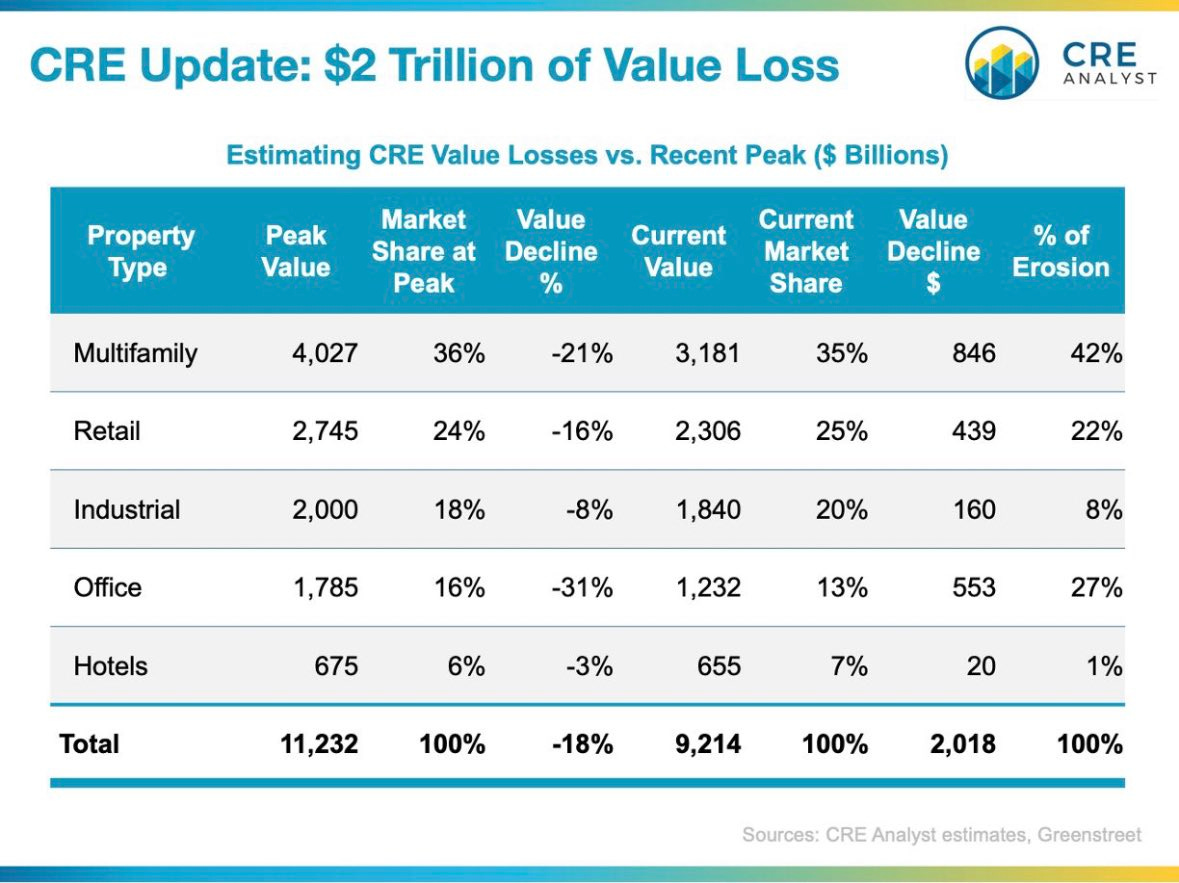
The level of denial when it comes to CRE is quite stunning. Although everyone knows it is a problem, they still don’t know it is a problem. The scale of this is just so large that I think most don’t want to understand. Instead they want to focus on the city-to-city problems.
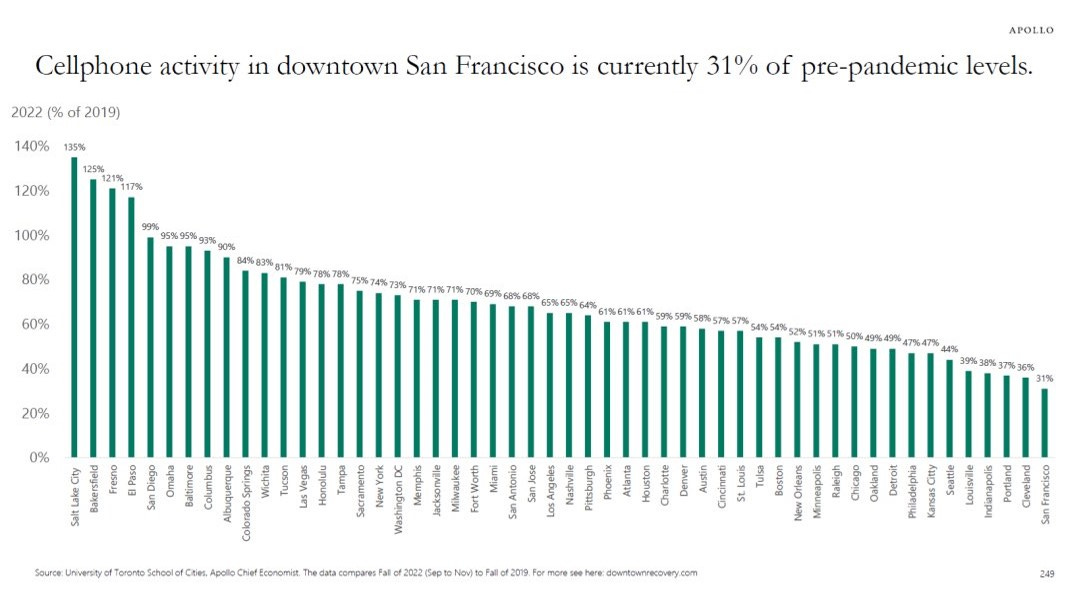
I think 18% as an average and 31% for office are optimistic. People want to make this about work-from-home, but it is so much more than that. Think of the scene in the Big Short when you see all the offices go up because of our hyper-financialized economy. Don’t let anyone fool you - we went all in on office - Evergrande style. And, we will have to pay the price.
San Francisco is everyone’s favorite whipping post, but I posted an article on Dallas changing direction on an underground transit system. Dallas has two huge towers in progress and currently low occupancy.
But, all of our cities are about to run into trouble. A dated graph, but still informative:
In other news last week, sounds like CBRE is revising its 2023 expectations for hotel revenue down after lackluster summer demand.
And, trouble in conversion from office to apartment paradise in Chicago.
Stay tuned….everyone is still in denial in my opinion.
Reference articles:
Loop landlord files for bankruptcy ahead of foreclosure sale | Crain's Chicago Business
Google Looks To Offload Another Big Office Campus in Silicon Valley (costar.com)
WeWork Risk Seen in Commercial Mortgage Bonds, Barclays Says (yahoo.com)
Big Banks Are Trying to Dump Commercial Real Estate Debt As Pressure Mounts (businessinsider.com)
The Commercial Real Estate-Small Bank Nexus | ZeroHedge
Local Malls, Stuck in ‘Death Spiral,’ Plunge in Value - WSJ
Troubles for Wall Street office tower worsen as foreclosure looms (nypost.com)
Understanding the challenges in the U.S. commercial property market
Commercial Property Investors Huge Office Bet is Unraveling In London, New York and Paris
Commercial Real Estate Reset is Causing Distress from Sand Francisco to Hong Kong
CRE’s Strains are contained: But in a recession the dam won’t hold. (contained you say?)
Big commercial real estate downturn could sink 300+ banks: Report | American Banker
Westfield Gives Up Downtown San Francisco Mall (sfstandard.com)
Goldman Sachs CEO Solomon warns of commercial real estate write-downs (cnbc.com)
Hotel Owners Start to Write Off San Francisco as Business Nosedives - WSJ
Sunbelt Construction Boom Threatens Top Apartment-Building Owners - WSJ
US banks prepare for losses in rush for commercial property exit | Financial Times (ft.com)
Interest-Only Loans Helped Commercial Property Boom. Now They’re Coming Due. - WSJ
Coming Soon: Whatever I can manage :). It’s been a crazy summer, and I still have to make a living, so I will do my best over the next several weeks as I try to do more local Florida research and keep my finger on the pulse of macro.
Reference
Rent
Last week’s updates included changes in rent metrics from RealPages. As mentioned here previously I have been struck by how little movement there has been using this source, but this month I noticed something interesting. RealPages started including some statistics in its write-up of each city including year-over-year changes in occupancy for all but a few key cities which is telling in and of itself. In case you haven’t seen this, RealPages is currently under investigation by the DOJ.
Average year-over-year decreases in occupancy for the cities I track and the cities that RealPages lists is -1.57%. Some of the key cities that are missing these stats in their write-ups: Chicago, Dallas, Houston, Nashville and Phoenix. Someone has shared a new source with me that I will be looking at next week as well.
Top Cities with Highest % Decrease in Average Rent June to July
Nashville -15.92%
Asheville -13.71%
Coeur d’Alene -11.88%
Destin -10.28%
Chicago -9.68%
Top Cities with Largest Decrease in Occupancy Year-Over-Year
Augusta -3.09%
Tucson -2.44%
Boise -2.30%
Atlanta -2.30%
Indianapolis -2.18%
Notable Mention: Miami - 1.91%
Airbnb/VRBO - Short-Term Rental (STR)
Top Cities for Short-Term Listings July
New York 26,809
Miami 14,502
Las Vegas 13,913
Los Angeles 11,765
Houston 11,588
Austin 10,911
Atlanta 10,879
San Diego 10,746
Orlando 9,763
Sevierville 8,816 (knocking out Nashville from June)
Top Cities with Biggest Increase in Short-Term Rental Listings Jun-July
Fort Myers 14.35%
Indianapolis 6.53%
Las Vegas 6.43%
San Diego 6.24%
Oceanside 5.32%
Top Cities with Biggest Decrease in Short-Term Rental Listings Jun-July
San Jose -6.37%
Phoenix -5.25%
Portsmouth -4.85%
San Ramon -4.30%
Tucson -4.16%
Top Cities with Biggest Increase in Short-Term Rental Listings Jan-July
Destin 37.32%
Coeur d’Alene 36.71%
Cape May 31.94%
San Ramon 28.99%
Palm Springs 22.49%
Top Cities with Biggest Decrease in Short-Term Rental Listings Jan-July
San Jose -21.04%
Dallas -18.02%
New York -13.39%
Fort Myers -11.82%
Houston -8.53%
Top Cities for Short-Term Listings July
New York 26,809
Miami 14,502
Las Vegas 13,913
Los Angeles 11,765
Houston 11,588
Austin 10,911
Atlanta 10,879
San Diego 10,746
Orlando 9,763
Sevierville 8,816 (knocking out Nashville from June)
From Inside Airbnb
As I’ve mentioned previously all data is not equal. Inside Airbnb has incredible data, but it is only for a handful of cities and is published once a quarter. Their listings tend to be much higher than the data provided by AirDNA and others, but they trend in the same direction. In October I will do a deep-dive on the differences and trending so we can see how closely the myriad data sources track. But, for example, Inside Airbnb data shows Nashville with 8,993 listings at the end of June while AirDNA has 8,105.
Only one city in the cities they track- Dallas - showed a decrease in listings from March to June which was likely due to the recent legislation. As the stock market took off so did everyone’s hopes and dreams. Unfortunately, I believe that not only will legislative efforts start to tick up (Airbnb’s lawsuit against NYC was dismissed last week), but the sentiment will likely sour in the next months based on macroeconomic clouds that are gathering.
Commercial Real Estate
Going to keep this incredible podcast with Jack Farley, John Toohig and Randy Woodward in this section until they do the next one - it’s just that good.
Per John, the only commercial real estate trading at the moment is for Trash and Trophies and despite MSM narratives trouble is on the horizon. Miss this at your own risk.







Those Lennar homes look hideous
Your ability to get into the weeds in this market is amazing - and all these hobby landlords were birthed from cheap money - I think some warning tagline like that used by the animal rescues - ‘puppies aren’t just for Christmas’ - should be applied to starry-eyed long-term borrowers - ‘cheap loans are not just for deal-closing day’ - or ‘renters aren’t forever’
Of course there is the truism - that there really isn’t such a thing as ‘getting rich quick’ - at least not if you play within the law.